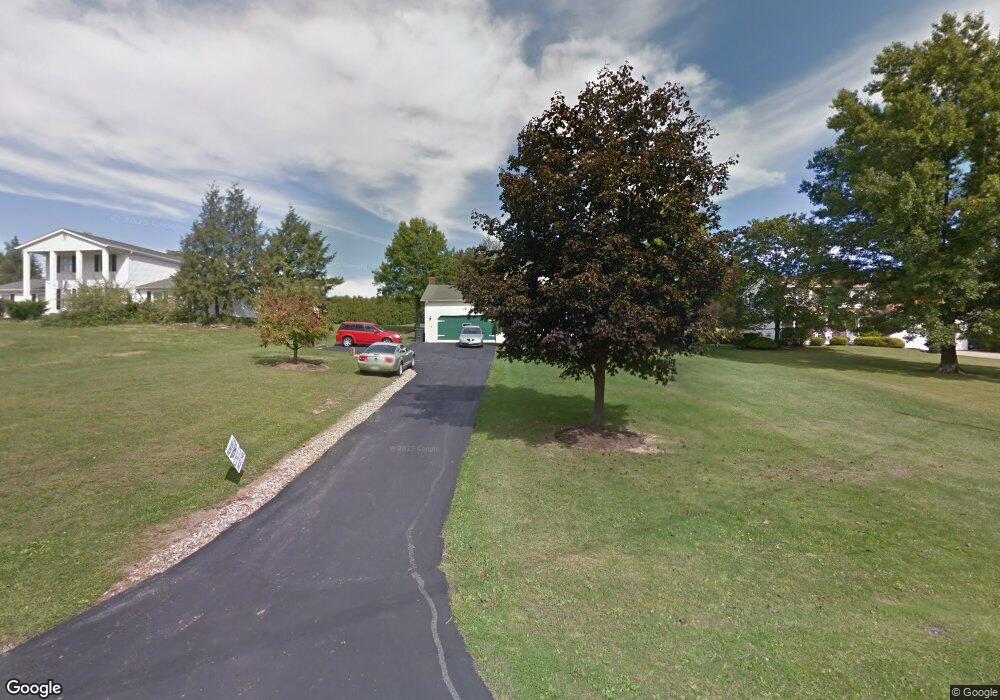
101 Paradise Rd Painesville, OH 44077
Estimated Value: $278,000 - $303,000
4
Beds
3
Baths
1,090
Sq Ft
$269/Sq Ft
Est. Value
About This Home
This home is located at 101 Paradise Rd, Painesville, OH 44077 and is currently estimated at $293,009, approximately $268 per square foot. 101 Paradise Rd is a home located in Lake County with nearby schools including Henry F. Lamuth Middle School, Riverside Junior/Senior High School, and Summit Academy Community School - Painesville.
Ownership History
Date
Name
Owned For
Owner Type
Purchase Details
Closed on
Aug 8, 2001
Sold by
Paugh John J and Paugh Vincenzina E
Bought by
Soto Rodriguez Martin and Soto Rodriguez Edith
Current Estimated Value
Home Financials for this Owner
Home Financials are based on the most recent Mortgage that was taken out on this home.
Original Mortgage
$167,373
Outstanding Balance
$65,289
Interest Rate
7.15%
Mortgage Type
FHA
Estimated Equity
$227,720
Purchase Details
Closed on
Nov 10, 1998
Sold by
Hibbard Charles E and Hibbard Therese A
Bought by
Paugh John J and Paugh Vincenzina E
Home Financials for this Owner
Home Financials are based on the most recent Mortgage that was taken out on this home.
Original Mortgage
$100,000
Interest Rate
6.59%
Purchase Details
Closed on
Jun 3, 1993
Bought by
Hibbard Charles E
Create a Home Valuation Report for This Property
The Home Valuation Report is an in-depth analysis detailing your home's value as well as a comparison with similar homes in the area
Home Values in the Area
Average Home Value in this Area
Purchase History
| Date | Buyer | Sale Price | Title Company |
|---|---|---|---|
| Soto Rodriguez Martin | $170,000 | House Of Title Agency Inc, T | |
| Paugh John J | $152,000 | Conway Land Title Company | |
| Hibbard Charles E | $134,000 | -- |
Source: Public Records
Mortgage History
| Date | Status | Borrower | Loan Amount |
|---|---|---|---|
| Open | Soto Rodriguez Martin | $167,373 | |
| Closed | Paugh John J | $100,000 |
Source: Public Records
Tax History Compared to Growth
Tax History
| Year | Tax Paid | Tax Assessment Tax Assessment Total Assessment is a certain percentage of the fair market value that is determined by local assessors to be the total taxable value of land and additions on the property. | Land | Improvement |
|---|---|---|---|---|
| 2024 | -- | $90,920 | $25,920 | $65,000 |
| 2023 | $7,422 | $68,110 | $20,700 | $47,410 |
| 2022 | $3,986 | $68,110 | $20,700 | $47,410 |
| 2021 | $4,000 | $68,110 | $20,700 | $47,410 |
| 2020 | $3,941 | $59,230 | $18,000 | $41,230 |
| 2019 | $3,970 | $59,230 | $18,000 | $41,230 |
| 2018 | $3,983 | $52,920 | $15,130 | $37,790 |
| 2017 | $3,720 | $52,920 | $15,130 | $37,790 |
| 2016 | $3,229 | $52,920 | $15,130 | $37,790 |
| 2015 | $3,030 | $52,920 | $15,130 | $37,790 |
| 2014 | $3,080 | $52,920 | $15,130 | $37,790 |
| 2013 | $3,010 | $52,920 | $15,130 | $37,790 |
Source: Public Records
Map
Nearby Homes
- 1160 Riverside Dr
- 238 Radley Dr
- 30 Orton Rd
- 104 Overlook Rd
- 85 Nelmar Dr
- 33 Bryn Mawr Dr
- 48 Nelmar Dr
- 5406 Pebble Creek Ln
- 44 Grove Ave
- 65 Tanners Farm Dr
- 65 Country Ln
- 67 Tanners Farm Dr
- 1182 Dalton Dr
- 1172 Dalton Dr
- 736 Rivers Edge Ln Unit 68
- 12745 Carter Rd
- 881 Rivers Edge Ln
- 498 Bank St
- 43 Bristol Ave
- 850 Bank St
- 111 Paradise Rd
- 91 Paradise Rd
- 81 Paradise Rd
- 121 Paradise Rd
- 41 Paradise Rd
- 131 Paradise Rd
- 20 Ridgecrest Dr
- 135 Paradise Rd
- 35 Paradise Rd
- 140 Paradise Rd
- 15 Ridgecrest Dr
- 48 Paradise
- 30 Paradise Rd
- 124 Paradise Rd
- 29 Paradise Rd
- 401 Armi Cir
- 28 Ridgecrest Dr
- 151 Paradise Rd
- 36 Ridgecrest Dr
- 400 Armi Cir