Estimated Value: $174,390 - $255,000
3
Beds
2
Baths
1,080
Sq Ft
$199/Sq Ft
Est. Value
About This Home
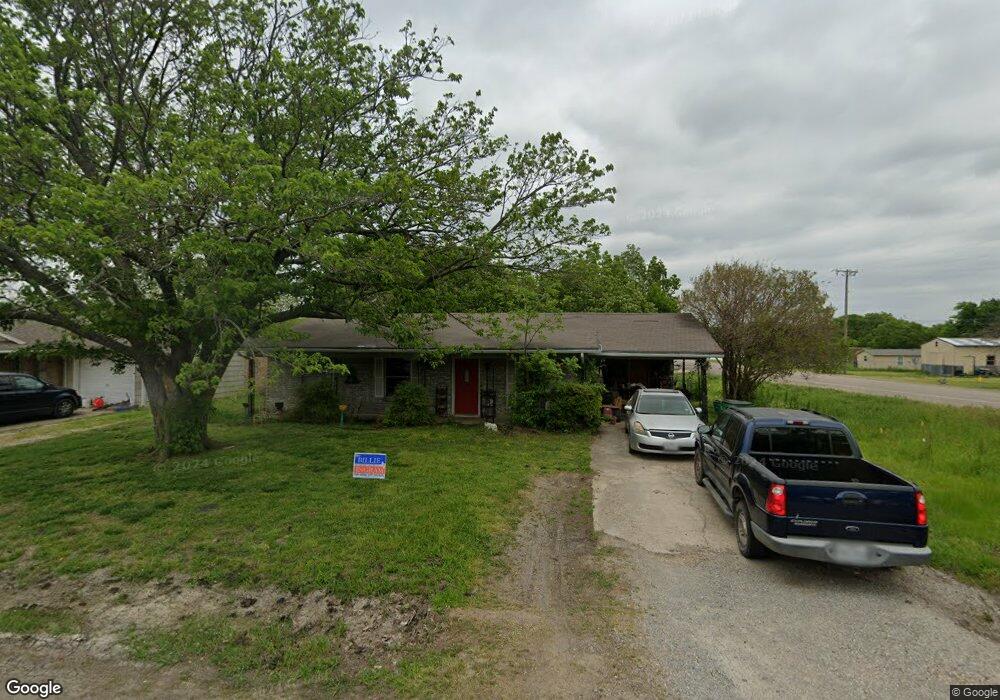
This home is located at 101 Pecan St, Howe, TX 75459 and is currently estimated at $214,695, approximately $198 per square foot. 101 Pecan St is a home located in Grayson County with nearby schools including Summit Hill Elementary School, Howe Middle School, and Howe High School.
Ownership History
Date
Name
Owned For
Owner Type
Purchase Details
Closed on
Aug 5, 2016
Sold by
Underwood Amber and Taylor Benjamin
Bought by
Ha Thomas
Current Estimated Value
Home Financials for this Owner
Home Financials are based on the most recent Mortgage that was taken out on this home.
Original Mortgage
$57,060
Interest Rate
3.48%
Mortgage Type
Future Advance Clause Open End Mortgage
Purchase Details
Closed on
Nov 1, 2005
Sold by
Underwood Christopher
Bought by
Underwood Amber
Purchase Details
Closed on
Nov 2, 2004
Sold by
Kisloski Kimberly D and Vogel Kimberly D
Bought by
Underwood Chris and Underwood Amber
Home Financials for this Owner
Home Financials are based on the most recent Mortgage that was taken out on this home.
Original Mortgage
$75,404
Interest Rate
5.66%
Mortgage Type
FHA
Create a Home Valuation Report for This Property
The Home Valuation Report is an in-depth analysis detailing your home's value as well as a comparison with similar homes in the area
Home Values in the Area
Average Home Value in this Area
Purchase History
| Date | Buyer | Sale Price | Title Company |
|---|---|---|---|
| Ha Thomas | -- | None Available | |
| Underwood Amber | -- | -- | |
| Underwood Chris | -- | -- |
Source: Public Records
Mortgage History
| Date | Status | Borrower | Loan Amount |
|---|---|---|---|
| Previous Owner | Ha Thomas | $57,060 | |
| Previous Owner | Underwood Chris | $75,404 |
Source: Public Records
Tax History
| Year | Tax Paid | Tax Assessment Tax Assessment Total Assessment is a certain percentage of the fair market value that is determined by local assessors to be the total taxable value of land and additions on the property. | Land | Improvement |
|---|---|---|---|---|
| 2025 | $2,552 | $120,471 | $59,252 | $61,219 |
| 2024 | $2,552 | $125,677 | $69,363 | $56,314 |
| 2023 | $2,397 | $118,000 | $56,649 | $61,351 |
| 2022 | $2,523 | $111,555 | $42,242 | $69,313 |
| 2021 | $2,037 | $81,230 | $32,319 | $48,911 |
| 2020 | $1,869 | $72,005 | $24,948 | $47,057 |
| 2019 | $2,116 | $77,251 | $24,948 | $52,303 |
| 2018 | $1,749 | $65,844 | $11,624 | $54,220 |
| 2017 | $1,672 | $62,181 | $11,624 | $50,557 |
| 2016 | $1,371 | $54,633 | $10,868 | $43,765 |
Source: Public Records
Map
Nearby Homes
- 112 W Elm St
- 711 S Farmington Rd
- 905 Calder St
- 921 Calder St
- 811 N Collins Fwy
- 941 Maple St
- 315 S Denny St
- 810 S Western Hills Dr
- 307 N Carter St
- 306 N College St
- 512 Bandera Dr
- 1135 Reed Cir
- 406 N Denny St
- 512 Branch St
- TBD E Young St
- 709 N Collins Fwy Unit 70
- 718 N Denny St
- 808 N Hughes St
- 1604 Elliott Rd
- 1516 Elliott Rd
Your Personal Tour Guide
Ask me questions while you tour the home.