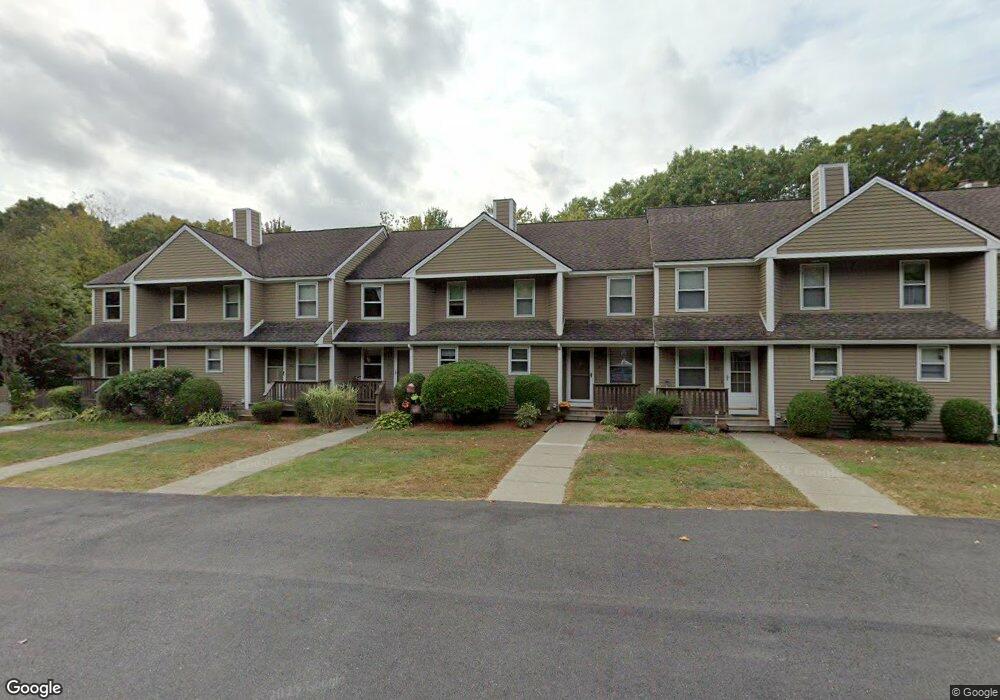
101 Pennacook Dr Unit 44 Leominster, MA 01453
Estimated Value: $329,000 - $342,000
2
Beds
2
Baths
1,093
Sq Ft
$306/Sq Ft
Est. Value
About This Home
This home is located at 101 Pennacook Dr Unit 44, Leominster, MA 01453 and is currently estimated at $334,246, approximately $305 per square foot. 101 Pennacook Dr Unit 44 is a home located in Worcester County with nearby schools including Leominster High School, St. Anna Catholic School, and St. Leo School.
Ownership History
Date
Name
Owned For
Owner Type
Purchase Details
Closed on
Feb 26, 2013
Sold by
Obeng Mary Y and Adonteng Sylvester K
Bought by
Hobbs Frederick B
Current Estimated Value
Purchase Details
Closed on
Oct 19, 2001
Sold by
Labrousse Paul J
Bought by
Adonteng Sylvester K and Obeng Mary Y
Home Financials for this Owner
Home Financials are based on the most recent Mortgage that was taken out on this home.
Original Mortgage
$130,150
Interest Rate
6.92%
Mortgage Type
Purchase Money Mortgage
Purchase Details
Closed on
Aug 24, 1999
Sold by
Fitch Stanley A
Bought by
Labrousse Paul J
Home Financials for this Owner
Home Financials are based on the most recent Mortgage that was taken out on this home.
Original Mortgage
$84,550
Interest Rate
7.6%
Mortgage Type
Purchase Money Mortgage
Create a Home Valuation Report for This Property
The Home Valuation Report is an in-depth analysis detailing your home's value as well as a comparison with similar homes in the area
Home Values in the Area
Average Home Value in this Area
Purchase History
| Date | Buyer | Sale Price | Title Company |
|---|---|---|---|
| Hobbs Frederick B | $115,000 | -- | |
| Adonteng Sylvester K | $137,000 | -- | |
| Labrousse Paul J | $89,000 | -- |
Source: Public Records
Mortgage History
| Date | Status | Borrower | Loan Amount |
|---|---|---|---|
| Previous Owner | Labrousse Paul J | $130,150 | |
| Previous Owner | Labrousse Paul J | $84,550 | |
| Previous Owner | Labrousse Paul J | $84,550 |
Source: Public Records
Tax History Compared to Growth
Tax History
| Year | Tax Paid | Tax Assessment Tax Assessment Total Assessment is a certain percentage of the fair market value that is determined by local assessors to be the total taxable value of land and additions on the property. | Land | Improvement |
|---|---|---|---|---|
| 2025 | $3,797 | $270,600 | $0 | $270,600 |
| 2024 | $3,661 | $252,300 | $0 | $252,300 |
| 2023 | $3,472 | $223,400 | $0 | $223,400 |
| 2022 | $2,924 | $176,600 | $0 | $176,600 |
| 2021 | $3,015 | $166,300 | $0 | $166,300 |
| 2020 | $2,898 | $161,200 | $0 | $161,200 |
| 2019 | $2,666 | $143,800 | $0 | $143,800 |
| 2018 | $2,596 | $134,300 | $0 | $134,300 |
| 2017 | $2,381 | $120,700 | $0 | $120,700 |
| 2016 | $2,103 | $107,400 | $0 | $107,400 |
| 2015 | $2,123 | $109,200 | $0 | $109,200 |
| 2014 | $2,044 | $108,200 | $0 | $108,200 |
Source: Public Records
Map
Nearby Homes
- 498 Lancaster St
- 851 Lancaster St
- 6 Longwood Ave
- 740 Central St Unit R24
- 740 Central St Unit L22
- 17 1st Ave
- 36 Meadow Pond Dr Unit I
- 30 Abbey Rd Unit 207
- 10 Abbey Rd Unit 108
- 30 Abbey Rd Unit 202
- 10 Abbey Rd Unit 205
- 556 Central St Unit 43
- 556 Central St Unit 39
- 197 Chapman Place Unit 197
- 213 Bayberry Hill Ln
- 64 Sycamore Dr
- 57 Chapman Place
- 177 Chapman Place
- 31 Johnson St
- 161 11th St
- 101 Pennacook Dr
- 99 Pennacook Dr
- 95 Pennacook Dr
- 95 Pennacook Dr Unit 95
- 93 Pennacook Dr
- 111 Pennacook Dr
- 111 Pennacook Dr Unit 54,111
- 89 Pennacook Dr
- 87 Pennacook Dr
- 83 Pennacook Dr
- 81 Pennacook Dr
- 87 Pennacook Dr Unit 87,N/A
- 87 Pennacook Dr Unit 30
- 115 Pennacook Dr Unit 58
- 117 Pennacook Dr Unit 117
- 117 Pennacook Dr
- 113 Pennacook Dr
- 109 Pennacook Dr
- 107 Pennacook Dr
- 117 Pennacook Dr Unit 60