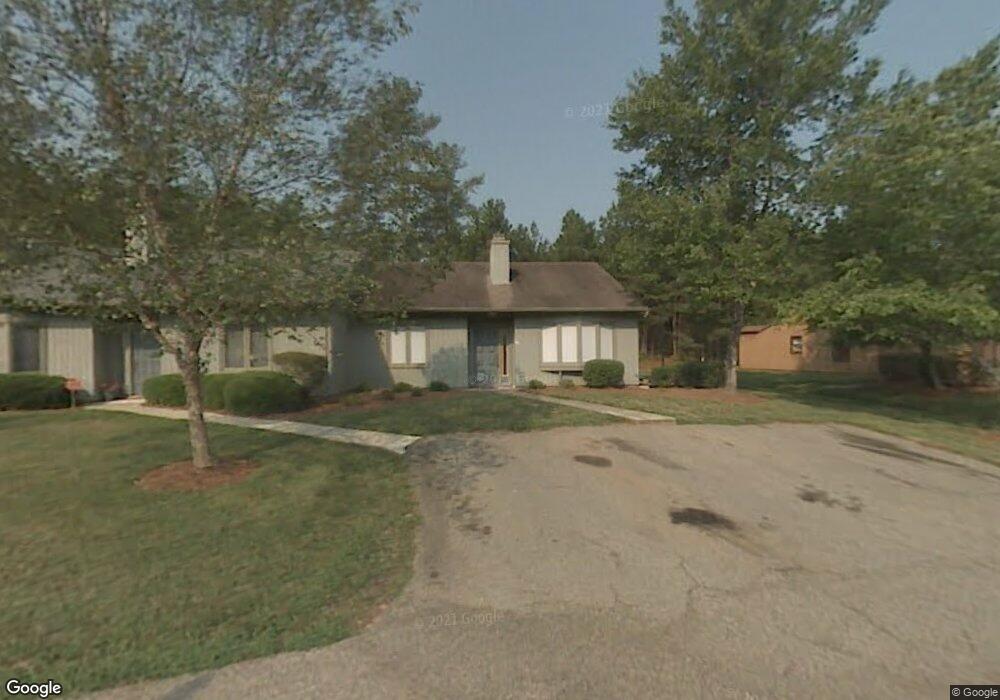
101 Perriwinkle Place Durham, NC 27713
Estimated Value: $231,000 - $248,848
2
Beds
2
Baths
1,165
Sq Ft
$207/Sq Ft
Est. Value
About This Home
This home is located at 101 Perriwinkle Place, Durham, NC 27713 and is currently estimated at $241,212, approximately $207 per square foot. 101 Perriwinkle Place is a home located in Durham County with nearby schools including Parkwood Elementary, Lowe's Grove Middle, and Hillside High School.
Ownership History
Date
Name
Owned For
Owner Type
Purchase Details
Closed on
Apr 5, 2021
Sold by
Adkinson John R and Adkinson Janice B
Bought by
Zubov Katherine
Current Estimated Value
Home Financials for this Owner
Home Financials are based on the most recent Mortgage that was taken out on this home.
Original Mortgage
$157,200
Outstanding Balance
$129,863
Interest Rate
2.9%
Mortgage Type
New Conventional
Estimated Equity
$111,349
Purchase Details
Closed on
Aug 30, 2007
Sold by
Nelson Joan A
Bought by
Adkinson John R and Adkinson Janice B
Home Financials for this Owner
Home Financials are based on the most recent Mortgage that was taken out on this home.
Original Mortgage
$99,116
Interest Rate
6.7%
Mortgage Type
FHA
Purchase Details
Closed on
Mar 13, 2002
Sold by
Campbell Larry and Nelson Joan A
Bought by
Nelson Joan A
Home Financials for this Owner
Home Financials are based on the most recent Mortgage that was taken out on this home.
Original Mortgage
$86,400
Interest Rate
6.98%
Mortgage Type
Balloon
Create a Home Valuation Report for This Property
The Home Valuation Report is an in-depth analysis detailing your home's value as well as a comparison with similar homes in the area
Home Values in the Area
Average Home Value in this Area
Purchase History
| Date | Buyer | Sale Price | Title Company |
|---|---|---|---|
| Zubov Katherine | $185,000 | None Available | |
| Adkinson John R | $100,000 | None Available | |
| Nelson Joan A | -- | -- |
Source: Public Records
Mortgage History
| Date | Status | Borrower | Loan Amount |
|---|---|---|---|
| Open | Zubov Katherine | $157,200 | |
| Previous Owner | Adkinson John R | $99,116 | |
| Previous Owner | Nelson Joan A | $86,400 |
Source: Public Records
Tax History Compared to Growth
Tax History
| Year | Tax Paid | Tax Assessment Tax Assessment Total Assessment is a certain percentage of the fair market value that is determined by local assessors to be the total taxable value of land and additions on the property. | Land | Improvement |
|---|---|---|---|---|
| 2025 | $1,780 | $230,625 | $55,000 | $175,625 |
| 2024 | $1,780 | $127,614 | $25,000 | $102,614 |
| 2023 | $1,672 | $127,614 | $25,000 | $102,614 |
| 2022 | $1,633 | $127,614 | $25,000 | $102,614 |
| 2021 | $1,626 | $127,614 | $25,000 | $102,614 |
| 2020 | $1,587 | $127,614 | $25,000 | $102,614 |
| 2019 | $1,587 | $127,614 | $25,000 | $102,614 |
| 2018 | $1,329 | $98,003 | $20,000 | $78,003 |
| 2017 | $1,320 | $98,003 | $20,000 | $78,003 |
| 2016 | $1,275 | $98,003 | $20,000 | $78,003 |
| 2015 | $1,391 | $100,475 | $21,400 | $79,075 |
| 2014 | -- | $100,475 | $21,400 | $79,075 |
Source: Public Records
Map
Nearby Homes
- 5 Huckleberry Ct
- 1109 Seaton Rd
- 1021 Park Glen Place
- 1227 Seaton Rd Unit 54
- 9 Monteith Ct
- 20 Summerglen Ct
- 1304 Seaton Rd Unit 1
- 1304 Seaton Rd Unit 24
- 205 Landreth Ct
- 5100 Mccormick Rd
- 12 Haycox Ct
- 7409 Chesley Ln
- 1019 Pondfield Way
- 5504 Pelham Rd
- 1621 Clermont Rd
- 6353 Grandale Dr
- 6609 Hunters Ln
- 616 Cheselden Dr
- 108 Ashmont Ln
- 5304 Lyon Farm Dr
- 101 Periwinkle Place
- 102 Perriwinkle Place
- 102 Periwinkle Place
- 103 Perriwinkle Place
- 103 Periwinkle Place
- 100 Perriwinkle Place
- 4817 Grandale Dr
- 99 Perriwinkle Place
- 104 Perriwinkle Place
- 104 Periwinkle Place
- 98 Periwinkle Place
- 98 Perriwinkle Place
- 88 Perriwinkle Place
- 87 Perriwinkle Place
- 87 Periwinkle Place
- 105 Perriwinkle Place
- 89 Perriwinkle Place
- 97 Perriwinkle Place
- 90 Perriwinkle Place
- 11 Colton Ct