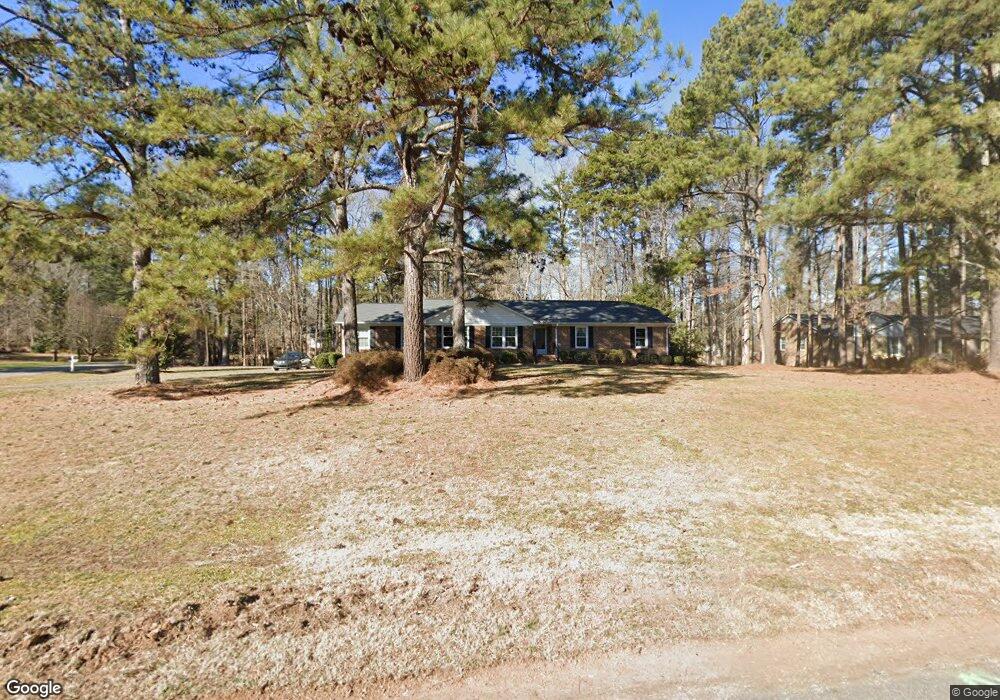
101 Planters Place Oxford, NC 27565
Estimated Value: $284,000 - $352,000
--
Bed
2
Baths
1,830
Sq Ft
$176/Sq Ft
Est. Value
About This Home
This home is located at 101 Planters Place, Oxford, NC 27565 and is currently estimated at $322,436, approximately $176 per square foot. 101 Planters Place is a home located in Granville County with nearby schools including Stovall-Shaw Elementary School, Northern Granville Middle School, and Hill City High School.
Ownership History
Date
Name
Owned For
Owner Type
Purchase Details
Closed on
Apr 11, 2024
Sold by
Newton Thomas D and Newton Kathy B
Bought by
Blackwell Cynthia A
Current Estimated Value
Home Financials for this Owner
Home Financials are based on the most recent Mortgage that was taken out on this home.
Original Mortgage
$275,405
Outstanding Balance
$271,337
Interest Rate
6.94%
Mortgage Type
New Conventional
Estimated Equity
$51,099
Purchase Details
Closed on
Nov 29, 2005
Sold by
Treacy Stephen V and Treacy Jinhe R
Bought by
Newton Thomas D
Home Financials for this Owner
Home Financials are based on the most recent Mortgage that was taken out on this home.
Original Mortgage
$50,000
Interest Rate
5.8%
Mortgage Type
New Conventional
Create a Home Valuation Report for This Property
The Home Valuation Report is an in-depth analysis detailing your home's value as well as a comparison with similar homes in the area
Home Values in the Area
Average Home Value in this Area
Purchase History
| Date | Buyer | Sale Price | Title Company |
|---|---|---|---|
| Blackwell Cynthia A | $290,000 | None Listed On Document | |
| Newton Thomas D | $185,000 | -- |
Source: Public Records
Mortgage History
| Date | Status | Borrower | Loan Amount |
|---|---|---|---|
| Open | Blackwell Cynthia A | $275,405 | |
| Previous Owner | Newton Thomas D | $50,000 |
Source: Public Records
Tax History Compared to Growth
Tax History
| Year | Tax Paid | Tax Assessment Tax Assessment Total Assessment is a certain percentage of the fair market value that is determined by local assessors to be the total taxable value of land and additions on the property. | Land | Improvement |
|---|---|---|---|---|
| 2025 | $3,121 | $266,608 | $50,000 | $216,608 |
| 2024 | $3,121 | $266,608 | $50,000 | $216,608 |
| 2023 | $3,119 | $179,384 | $35,000 | $144,384 |
| 2022 | $2,640 | $179,384 | $35,000 | $144,384 |
| 2021 | $2,675 | $179,384 | $35,000 | $144,384 |
| 2020 | $2,675 | $179,384 | $35,000 | $144,384 |
| 2019 | $2,675 | $179,384 | $35,000 | $144,384 |
| 2018 | $2,675 | $179,384 | $35,000 | $144,384 |
| 2016 | $2,642 | $172,504 | $35,000 | $137,504 |
| 2015 | $2,555 | $169,286 | $35,000 | $134,286 |
| 2014 | $2,504 | $169,286 | $35,000 | $134,286 |
| 2013 | -- | $169,286 | $35,000 | $134,286 |
Source: Public Records
Map
Nearby Homes
- 230 Saddletree Rd
- 102 Royall Rd
- 504 Henderson St
- 505 Forest Rd
- 100 Maluli Dr
- 110 Maluli Dr
- 715 Williamsboro St
- 412 Kingsbury St
- 104 Parker St
- 103 Forest Rd
- 106 Summitt Ave
- 0 Hillandale Dr
- 617 Raleigh St
- 501 Raleigh St
- 608 Raleigh St
- 221 Gilliam St
- 211 Wilmington Ave
- 6609 Clearwater Dr
- 412 Coggeshall St
- 421 Granville St
- 103 Planters Place
- 103 Planters Glen Place
- 100 Saddletree Rd
- 102 Saddletree Rd
- 304 Hunters Rd
- 105 Planters Place
- 105 Planters Place
- 100 Planters Place
- 302 Hunters Rd
- 302 Hunters Rd
- 102 Planters Place
- 313 Saddletree Rd
- 300 Hunters Rd
- 106 Saddletree Rd
- 5and6 Saddletree Rd
- Lot 6 Saddletree Rd
- Lot 8 Saddletree Rd
- 0 Saddletree Rd
- Lot 6 Saddletree Rd Unit 6
- Lot 8 Saddletree Rd Unit Lot 8