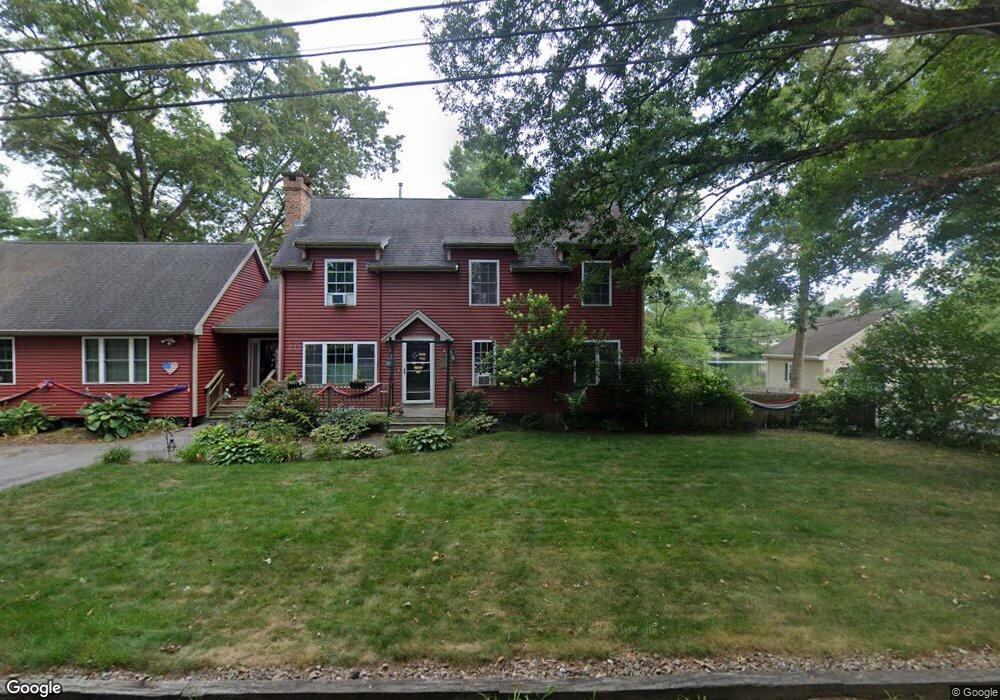
101 Pond St Rehoboth, MA 02769
Estimated Value: $635,331 - $836,000
5
Beds
1
Bath
1,824
Sq Ft
$395/Sq Ft
Est. Value
About This Home
This home is located at 101 Pond St, Rehoboth, MA 02769 and is currently estimated at $720,583, approximately $395 per square foot. 101 Pond St is a home located in Bristol County with nearby schools including Dighton-Rehoboth Regional High School and Cedar Brook School.
Ownership History
Date
Name
Owned For
Owner Type
Purchase Details
Closed on
Jul 16, 1999
Sold by
Pehoviak Paul
Bought by
Haskell Mark S and Haskell Stacy J
Current Estimated Value
Home Financials for this Owner
Home Financials are based on the most recent Mortgage that was taken out on this home.
Original Mortgage
$139,929
Outstanding Balance
$38,669
Interest Rate
7.39%
Mortgage Type
Purchase Money Mortgage
Estimated Equity
$681,914
Purchase Details
Closed on
Apr 2, 1999
Sold by
Boulais Gary W
Bought by
Pehoviak Paul
Purchase Details
Closed on
Oct 12, 1995
Sold by
Young Curtis D and Young Joanna I
Bought by
Boulais Gary W and Boulais Michelle M
Home Financials for this Owner
Home Financials are based on the most recent Mortgage that was taken out on this home.
Original Mortgage
$131,070
Interest Rate
7.71%
Mortgage Type
Purchase Money Mortgage
Create a Home Valuation Report for This Property
The Home Valuation Report is an in-depth analysis detailing your home's value as well as a comparison with similar homes in the area
Home Values in the Area
Average Home Value in this Area
Purchase History
| Date | Buyer | Sale Price | Title Company |
|---|---|---|---|
| Haskell Mark S | $139,000 | -- | |
| Pehoviak Paul | $104,600 | -- | |
| Boulais Gary W | $128,500 | -- |
Source: Public Records
Mortgage History
| Date | Status | Borrower | Loan Amount |
|---|---|---|---|
| Open | Boulais Gary W | $11,200 | |
| Open | Boulais Gary W | $139,929 | |
| Previous Owner | Boulais Gary W | $131,070 |
Source: Public Records
Tax History
| Year | Tax Paid | Tax Assessment Tax Assessment Total Assessment is a certain percentage of the fair market value that is determined by local assessors to be the total taxable value of land and additions on the property. | Land | Improvement |
|---|---|---|---|---|
| 2025 | $59 | $531,400 | $150,400 | $381,000 |
| 2024 | $6,111 | $537,900 | $165,500 | $372,400 |
| 2023 | $5,659 | $488,700 | $162,200 | $326,500 |
| 2022 | $5,444 | $429,700 | $154,800 | $274,900 |
| 2021 | $18 | $392,500 | $140,500 | $252,000 |
| 2020 | $5,150 | $392,500 | $140,500 | $252,000 |
| 2018 | $4,442 | $371,100 | $133,800 | $237,300 |
| 2017 | $4,987 | $341,400 | $133,800 | $207,600 |
| 2016 | $4,148 | $341,400 | $133,800 | $207,600 |
| 2015 | $3,896 | $316,500 | $127,400 | $189,100 |
| 2014 | $3,863 | $310,500 | $121,400 | $189,100 |
Source: Public Records
Map
Nearby Homes
- 23 Colonial Way
- 111 Summer St
- 67 Wheeler St
- 20 School St
- 0 Winter St
- 149 Broad St
- 6 Running Stream Rd
- 15 Hickory Ridge Rd
- 321 Winthrop St
- 16 Salisbury St
- 31 Woodland Way
- 145 Winthrop St
- 139 Winthrop St
- 8 Linden Ln
- 8 Linden Ln
- 248 County
- 205 Providence St Bldr Lot 3
- 203 Providence St Bldr Lot 5
- 420 Chestnut St
- 23 Bay State Rd
Your Personal Tour Guide
Ask me questions while you tour the home.