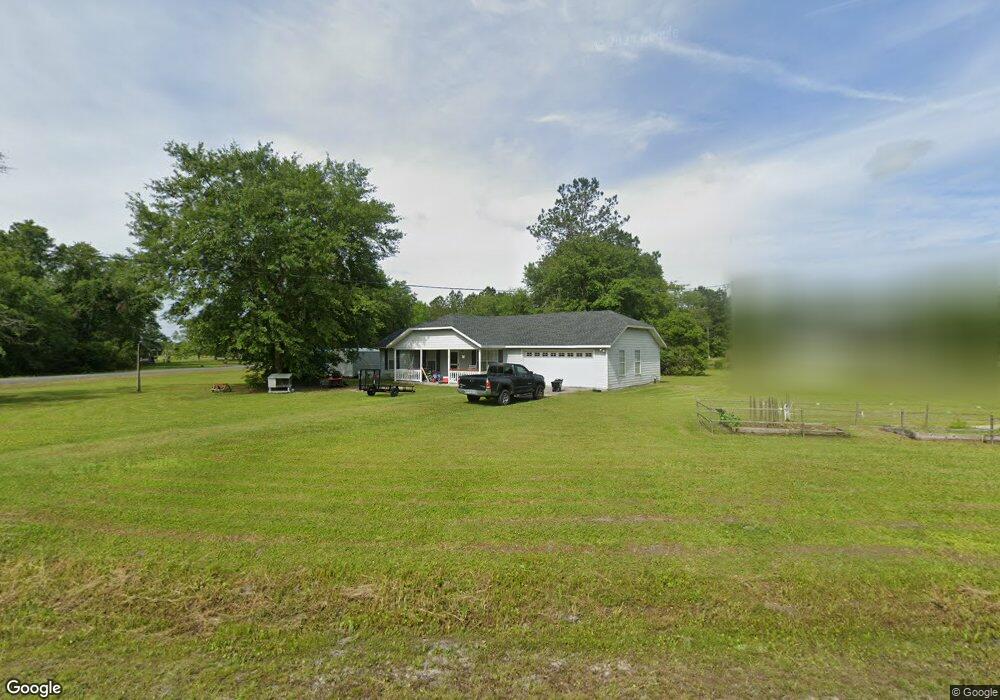
101 Quail Ln Folkston, GA 31537
Estimated Value: $277,000 - $372,000
3
Beds
2
Baths
2,320
Sq Ft
$132/Sq Ft
Est. Value
About This Home
This home is located at 101 Quail Ln, Folkston, GA 31537 and is currently estimated at $307,117, approximately $132 per square foot. 101 Quail Ln is a home located in Charlton County with nearby schools including Charlton County High School and Charlton Christian Academy.
Ownership History
Date
Name
Owned For
Owner Type
Purchase Details
Closed on
Nov 25, 2014
Sold by
King Shaun A
Bought by
Harden Amber Nicole
Current Estimated Value
Home Financials for this Owner
Home Financials are based on the most recent Mortgage that was taken out on this home.
Original Mortgage
$114,285
Outstanding Balance
$87,863
Interest Rate
4.02%
Mortgage Type
New Conventional
Estimated Equity
$219,254
Purchase Details
Closed on
Oct 14, 2011
Sold by
Secretary Department Of Housing & Urban
Bought by
King Shaun A
Purchase Details
Closed on
Jan 4, 2011
Sold by
Hale Tracy
Bought by
Embrace Home Loans
Purchase Details
Closed on
Nov 19, 2004
Sold by
Anderson Bruce
Bought by
Hale Tracy
Purchase Details
Closed on
Nov 14, 2003
Sold by
White George W
Bought by
Anderson Bruce
Purchase Details
Closed on
Apr 23, 2001
Sold by
White George W
Bought by
White George W
Purchase Details
Closed on
Nov 3, 1972
Bought by
White George W
Create a Home Valuation Report for This Property
The Home Valuation Report is an in-depth analysis detailing your home's value as well as a comparison with similar homes in the area
Home Values in the Area
Average Home Value in this Area
Purchase History
| Date | Buyer | Sale Price | Title Company |
|---|---|---|---|
| Harden Amber Nicole | $110,000 | -- | |
| King Shaun A | $87,000 | -- | |
| Embrace Home Loans | $168,100 | -- | |
| Hale Tracy | $150,000 | -- | |
| Anderson Bruce | $8,900 | -- | |
| White George W | -- | -- | |
| White George W | -- | -- |
Source: Public Records
Mortgage History
| Date | Status | Borrower | Loan Amount |
|---|---|---|---|
| Open | Harden Amber Nicole | $114,285 |
Source: Public Records
Tax History Compared to Growth
Tax History
| Year | Tax Paid | Tax Assessment Tax Assessment Total Assessment is a certain percentage of the fair market value that is determined by local assessors to be the total taxable value of land and additions on the property. | Land | Improvement |
|---|---|---|---|---|
| 2024 | $3,307 | $112,200 | $6,000 | $106,200 |
| 2023 | $3,363 | $107,120 | $6,000 | $101,120 |
| 2022 | $2,783 | $88,400 | $6,000 | $82,400 |
| 2021 | $2,493 | $63,720 | $4,000 | $59,720 |
| 2020 | $2,737 | $63,720 | $4,000 | $59,720 |
| 2019 | $2,495 | $63,720 | $4,000 | $59,720 |
| 2018 | $2,523 | $63,720 | $4,000 | $59,720 |
| 2017 | $2,483 | $62,920 | $4,000 | $58,920 |
| 2016 | $2,578 | $62,920 | $4,000 | $58,920 |
| 2015 | -- | $62,920 | $4,000 | $58,920 |
| 2014 | -- | $62,920 | $4,000 | $58,920 |
| 2013 | -- | $63,640 | $4,000 | $59,640 |
Source: Public Records
Map
Nearby Homes
- 205 Settlers Way
- 651 Boulevard St
- 557 Boulevard St
- 0 Dogwood Ln Unit LOT B 10611183
- 0 Old Traders Hill Rd Unit 2.84 ACRE PARCEL LOT
- 646 Grande Ave
- 235 Magnolia St
- 248 Cotton St
- 190 Forest Lake Dr
- 120 John H Carter III Ln
- 3204 Route 1
- 0 (LOT 6) Dogwood Ln
- 0 (LOT 5) Dogwood Ln Unit LOT 5
- 0 (LOT 4) Dogwood Ln Unit LOT 4
- 0 (LOT 3) Dogwood Ln Unit LOT 3
- 0(LOT 2) Dogwood Ln Unit LOT 2
- 0 (LOT 1) Dogwood Ln Unit LOT 1
- 220 Albert Smith St
- 111 Jenny Ct
- 0 Passieu Cir Unit 20171701
- 85 Quail Ln
- 103 Quail Ln
- 0 Quail Ln Unit 1581750
- 0 Quail Ln Unit 7522343
- 0 Quail Ln Unit 8003552
- 0 Quail Ln Unit 8087066
- 0 Quail Ln Unit 8202430
- 0 Quail Ln Unit 1607730
- 0 Quail Ln Unit 8542573
- 617 Robin Ln
- 9 Quail Ln
- 106 Quail Ln
- 96 Quail Ln
- 96 Quail Ln Unit 8
- 96 Quail Ln
- 103 Dove Ln
- 101 Dove Ln
- 35 Dove Ln
- 83 Wren Ln
- 0 Wren Ln