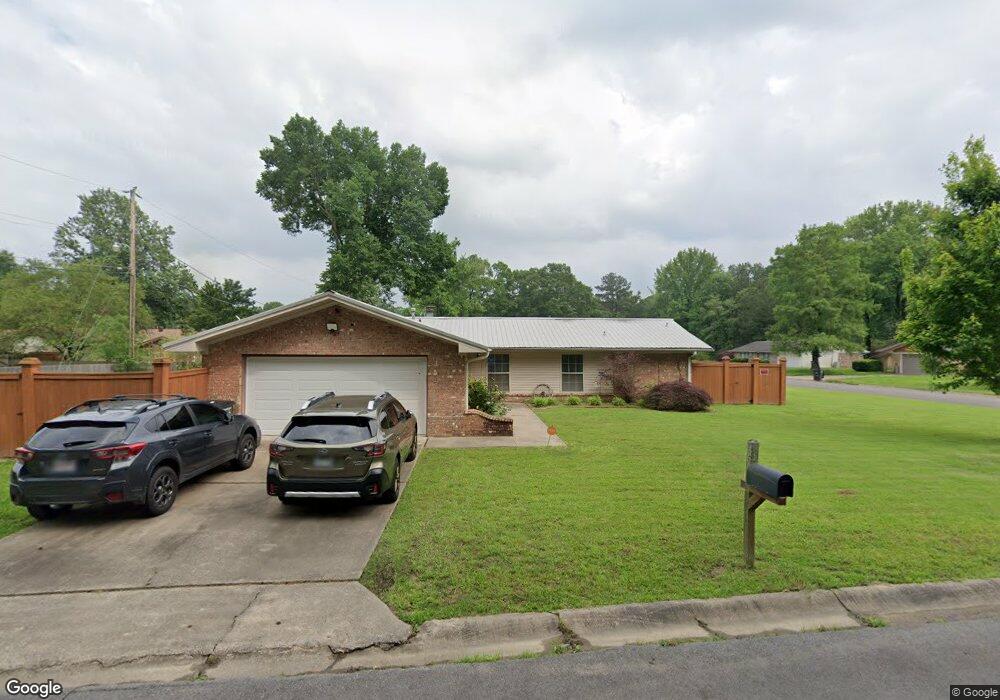
101 Quapaw Place Jacksonville, AR 72076
Estimated Value: $155,000 - $246,000
--
Bed
2
Baths
2,100
Sq Ft
$95/Sq Ft
Est. Value
About This Home
This home is located at 101 Quapaw Place, Jacksonville, AR 72076 and is currently estimated at $198,716, approximately $94 per square foot. 101 Quapaw Place is a home located in Pulaski County with nearby schools including Jacksonville Elementary School, Jacksonville Middle School, and Jacksonville High School.
Ownership History
Date
Name
Owned For
Owner Type
Purchase Details
Closed on
Dec 19, 2007
Sold by
Dailey John Thomas and Dailey Diane
Bought by
Rawdon Jeffery L
Current Estimated Value
Home Financials for this Owner
Home Financials are based on the most recent Mortgage that was taken out on this home.
Original Mortgage
$108,300
Outstanding Balance
$68,408
Interest Rate
6.26%
Mortgage Type
FHA
Estimated Equity
$130,309
Purchase Details
Closed on
Sep 20, 2004
Sold by
Dailey John Thomas
Bought by
Dailey Ruthanne Rene
Purchase Details
Closed on
Sep 16, 2004
Sold by
Dailey Ruthanne Rene
Bought by
Dailey John Thomas
Purchase Details
Closed on
Jul 26, 2001
Sold by
Iles Stephen B and Iles Anna Marie
Bought by
Dailey John Thomas and Dailey Ruthanne Rene
Home Financials for this Owner
Home Financials are based on the most recent Mortgage that was taken out on this home.
Original Mortgage
$93,840
Interest Rate
7.07%
Mortgage Type
VA
Create a Home Valuation Report for This Property
The Home Valuation Report is an in-depth analysis detailing your home's value as well as a comparison with similar homes in the area
Home Values in the Area
Average Home Value in this Area
Purchase History
| Date | Buyer | Sale Price | Title Company |
|---|---|---|---|
| Rawdon Jeffery L | $110,000 | Mcwilliams & Turner Title Co | |
| Dailey Ruthanne Rene | -- | Professional Land Title Comp | |
| Dailey John Thomas | -- | Professional Land Title Comp | |
| Dailey John Thomas | $92,000 | -- |
Source: Public Records
Mortgage History
| Date | Status | Borrower | Loan Amount |
|---|---|---|---|
| Open | Rawdon Jeffery L | $108,300 | |
| Previous Owner | Dailey John Thomas | $93,840 |
Source: Public Records
Tax History Compared to Growth
Tax History
| Year | Tax Paid | Tax Assessment Tax Assessment Total Assessment is a certain percentage of the fair market value that is determined by local assessors to be the total taxable value of land and additions on the property. | Land | Improvement |
|---|---|---|---|---|
| 2025 | $1,763 | $33,321 | $4,400 | $28,921 |
| 2024 | $1,416 | $33,321 | $4,400 | $28,921 |
| 2023 | $1,416 | $33,321 | $4,400 | $28,921 |
| 2022 | $1,542 | $33,321 | $4,400 | $28,921 |
| 2021 | $1,469 | $23,920 | $2,800 | $21,120 |
| 2020 | $1,094 | $23,920 | $2,800 | $21,120 |
| 2019 | $1,094 | $23,920 | $2,800 | $21,120 |
| 2018 | $1,119 | $23,920 | $2,800 | $21,120 |
| 2017 | $1,119 | $23,920 | $2,800 | $21,120 |
| 2016 | $1,149 | $24,410 | $4,510 | $19,900 |
| 2015 | $1,313 | $24,410 | $4,510 | $19,900 |
| 2014 | $1,313 | $24,410 | $4,510 | $19,900 |
Source: Public Records
Map
Nearby Homes
- 104 Foxdell Cir
- 3404 T P White Dr
- 110 Chickasaw Place
- 7620 T P White Dr
- 134 Foxdell Cir
- 113 Shawnee Place
- 24 Woodland Dr
- 3636 T P White Dr
- 2800 Gray Fox Ln
- 10 Woodland Dr
- 2718 Gray Fox Ln
- 3005 T P White Dr
- 2706 Northeastern Ave
- 1 Foxboro Cove
- 7824 T P White Dr
- 23 Club Rd
- 5808 Rope Trail
- 1616 Plummer Dr
- 108 Dale Dr
- 2405 Chapel Hill Rd
- lot3 Blk9 Quapaw Place
- 103 Quapaw Place
- 100 Chickasaw Place
- 102 Chickasaw Place
- 0 Quapaw Place
- 100 Quapaw Place
- 105 Quapaw Place
- 102 Quapaw Place
- 104 Chickasaw Place
- 104 Quapaw Place
- 107 Quapaw Place
- 101 Chickasaw Place
- 106 Chickasaw Place
- 103 Chickasaw Place
- 105 Chickasaw Place
- 108 Chickasaw Place
- 3400 T P White Dr
- 107 Chickasaw Place
- 3412 T P White Dr
- 100 Arapaho Place