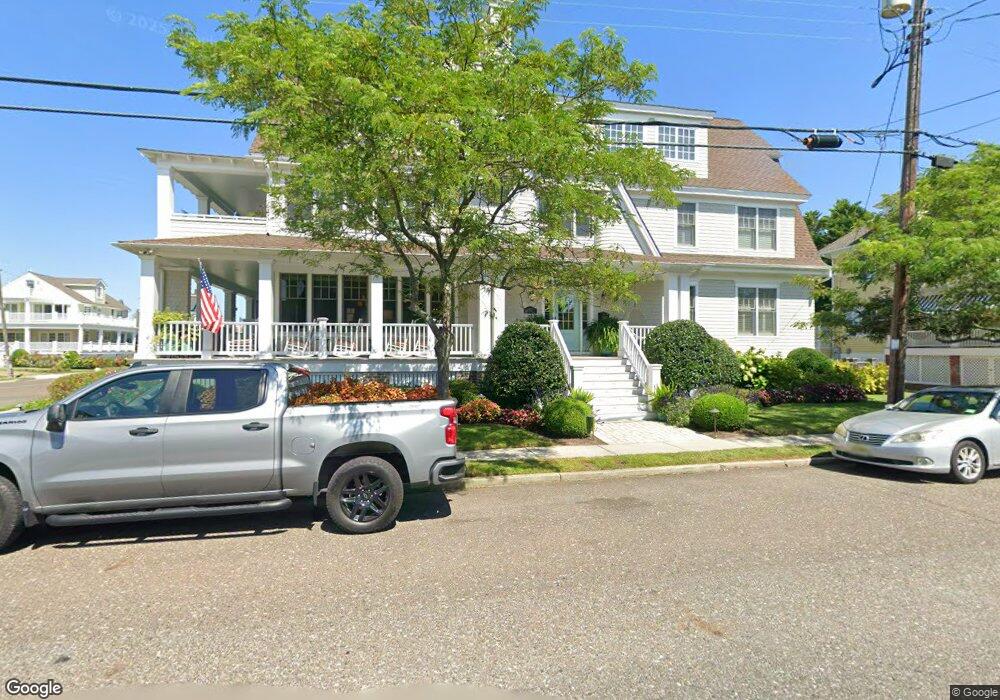
101 Queen St Cape May, NJ 08204
Estimated Value: $4,785,000 - $5,712,000
Studio
--
Bath
6,048
Sq Ft
$855/Sq Ft
Est. Value
About This Home
This home is located at 101 Queen St, Cape May, NJ 08204 and is currently estimated at $5,172,877, approximately $855 per square foot. 101 Queen St is a home located in Cape May County with nearby schools including Cape May City Elementary School, Richard M. Teitelman School, and Lower Cape May Regional High School.
Ownership History
Date
Name
Owned For
Owner Type
Purchase Details
Closed on
Dec 29, 2020
Sold by
Divito Margaret and Hoffman Mark A
Bought by
Maguire Susan G and Maguire Edward
Current Estimated Value
Purchase Details
Closed on
Aug 21, 2018
Sold by
Patton William and Patton Tarice
Bought by
Hoffman Mark A and Divito Margaret E
Home Financials for this Owner
Home Financials are based on the most recent Mortgage that was taken out on this home.
Original Mortgage
$1,400,000
Interest Rate
3.5%
Mortgage Type
Adjustable Rate Mortgage/ARM
Purchase Details
Closed on
Sep 19, 2006
Sold by
Heal Joanne D
Bought by
Patton William and Patton Tarice
Home Financials for this Owner
Home Financials are based on the most recent Mortgage that was taken out on this home.
Original Mortgage
$1,300,000
Interest Rate
6.52%
Mortgage Type
Purchase Money Mortgage
Create a Home Valuation Report for This Property
The Home Valuation Report is an in-depth analysis detailing your home's value as well as a comparison with similar homes in the area
Home Values in the Area
Average Home Value in this Area
Purchase History
| Date | Buyer | Sale Price | Title Company |
|---|---|---|---|
| Maguire Susan G | $3,510,000 | Misc Company | |
| Hoffman Mark A | $3,160,000 | -- | |
| Patton William | $1,125,000 | The Title Company Of Jersey |
Source: Public Records
Mortgage History
| Date | Status | Borrower | Loan Amount |
|---|---|---|---|
| Previous Owner | Hoffman Mark A | $1,400,000 | |
| Previous Owner | Patton William | $1,300,000 |
Source: Public Records
Tax History
| Year | Tax Paid | Tax Assessment Tax Assessment Total Assessment is a certain percentage of the fair market value that is determined by local assessors to be the total taxable value of land and additions on the property. | Land | Improvement |
|---|---|---|---|---|
| 2025 | $23,850 | $2,256,400 | $894,500 | $1,361,900 |
| 2024 | $23,850 | $2,256,400 | $894,500 | $1,361,900 |
Source: Public Records
Map
Nearby Homes
- 610 Beach Ave
- 819 Beach Ave Unit 3B
- 824 Stockton Ave
- 316 Jefferson St Unit 3
- 106 Howard St Unit A
- 106 A Howard St
- 519 Franklin St
- 626 Hughes St
- 645 Hughes St
- 1202 Maryland Ave
- 1205 Beach Ave Unit 3
- 202 Ocean St
- 933 Washington St
- 1001 Washington St Unit 1A
- 1001 Washington St Unit 5B
- 130 Decatur St
- 936 Lafayette St Unit 5
- 42 Jackson St Unit 3
- 517 Broad St Unit B
- 1323 New Jersey Ave
- 1003 Stockton Ave
- 1005 Stockton Ave
- 105 Queen St
- 1007 Stockton Ave
- 1010 Kearney Ave
- 21 Queen St
- 925 Stockton Ave
- 1012 Kearney Ave
- 1009 Stockton Ave
- 112 Queen St
- 1012 Stockton Ave
- 923 Stockton Ave
- 1014 Kearney Ave
- 15 Queen St
- 1013 Stockton Ave
- 20 Queen St
- 1016 Stockton Ave
- 1018 Stockton Ave
- 921 Stockton Ave
- 1003 Kearney Ave
Your Personal Tour Guide
Ask me questions while you tour the home.