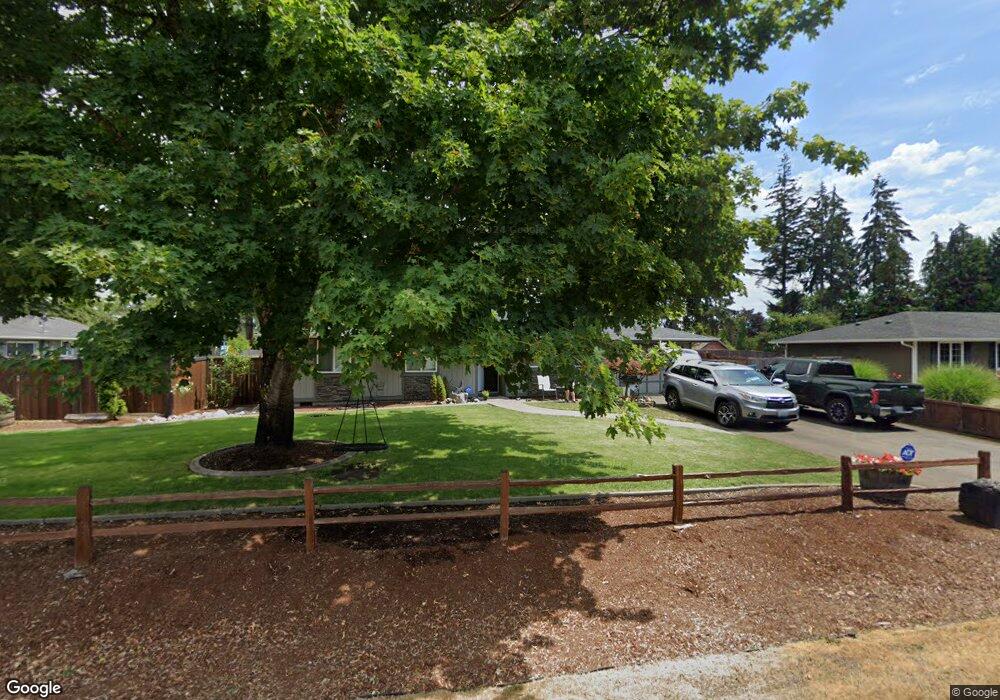
101 Raintree Loop SE Rainier, WA 98576
Estimated Value: $380,000 - $500,000
3
Beds
1
Bath
1,335
Sq Ft
$325/Sq Ft
Est. Value
About This Home
This home is located at 101 Raintree Loop SE, Rainier, WA 98576 and is currently estimated at $433,504, approximately $324 per square foot. 101 Raintree Loop SE is a home located in Thurston County with nearby schools including Rainier Elementary School, Rainier Middle School, and Rainier Senior High School.
Ownership History
Date
Name
Owned For
Owner Type
Purchase Details
Closed on
Mar 25, 2010
Sold by
Dross Lisa P
Bought by
Greenwood Barrett S and Greenwood Elizabeth J
Current Estimated Value
Home Financials for this Owner
Home Financials are based on the most recent Mortgage that was taken out on this home.
Original Mortgage
$110,500
Outstanding Balance
$72,222
Interest Rate
4.94%
Mortgage Type
VA
Estimated Equity
$361,282
Purchase Details
Closed on
May 14, 1996
Sold by
Gotcher Charles V and Gotcher Susan A
Bought by
Dross Nathan and Dross Lisa P
Home Financials for this Owner
Home Financials are based on the most recent Mortgage that was taken out on this home.
Original Mortgage
$103,530
Interest Rate
7.8%
Mortgage Type
VA
Create a Home Valuation Report for This Property
The Home Valuation Report is an in-depth analysis detailing your home's value as well as a comparison with similar homes in the area
Home Values in the Area
Average Home Value in this Area
Purchase History
| Date | Buyer | Sale Price | Title Company |
|---|---|---|---|
| Greenwood Barrett S | $94,980 | Chicago Title Company | |
| Dross Nathan | $101,500 | First American Title Ins Co |
Source: Public Records
Mortgage History
| Date | Status | Borrower | Loan Amount |
|---|---|---|---|
| Open | Greenwood Barrett S | $110,500 | |
| Previous Owner | Dross Nathan | $103,530 |
Source: Public Records
Tax History
| Year | Tax Paid | Tax Assessment Tax Assessment Total Assessment is a certain percentage of the fair market value that is determined by local assessors to be the total taxable value of land and additions on the property. | Land | Improvement |
|---|---|---|---|---|
| 2025 | $3,263 | $415,700 | $117,000 | $298,700 |
| 2024 | $3,263 | $364,400 | $105,500 | $258,900 |
| 2023 | $3,263 | $347,700 | $96,800 | $250,900 |
| 2022 | $2,854 | $338,200 | $71,500 | $266,700 |
| 2021 | $2,265 | $276,400 | $59,100 | $217,300 |
| 2020 | $2,210 | $215,600 | $56,600 | $159,000 |
| 2019 | $2,018 | $190,600 | $48,000 | $142,600 |
| 2018 | $2,158 | $170,700 | $43,200 | $127,500 |
| 2017 | $1,995 | $163,250 | $38,850 | $124,400 |
| 2016 | $1,948 | $151,050 | $43,150 | $107,900 |
| 2014 | -- | $146,850 | $43,150 | $103,700 |
Source: Public Records
Map
Nearby Homes
- 604 Nieland Loop SE
- 605 Hubbard Rd SE
- 302 Centre St N
- 108 2nd St SE
- 108 Centre St S
- 309 Binghampton St SE
- 733 Tipsoo Loop S
- 308 Easy St SE
- 414 Easy St SE
- 955 Tipsoo Loop N
- 101 Murphy Ln S
- 210 Country Estates Dr W
- 701 Myers St SE
- 810 Cody St SE
- 132 xx Algyer Rd SE
- 823 Tipsoo Loop S
- 9912 138th Ave SE
- 14403 Brandie Ct SE
- 14319 123rd Ave SE
- 14913 Champion Estates Dr SE
- 208 133rd Ave SE
- 103 Raintree Loop SE
- 206 133rd Ave SE
- 302 133rd Ave SE
- 105 Raintree Loop SE
- 107 Raintree Loop SE
- 304 133rd Ave SE
- 104 Raintree Loop SE
- 101 Rainier Estates Ct SE
- 109 Raintree Loop SE
- 103 Rainier Estates Ct SE
- 107 Rainier Estates Ct SE
- 306 133rd Ave SE
- 105 Rainier Estates Ct SE
- 106 Raintree Loop SE
- 102 Carver Walk SE
- 140 134th Ct SE
- 111 Raintree Loop SE
- 109 Rainier Estates Ct SE
- 110 Raintree Loop SE
Your Personal Tour Guide
Ask me questions while you tour the home.