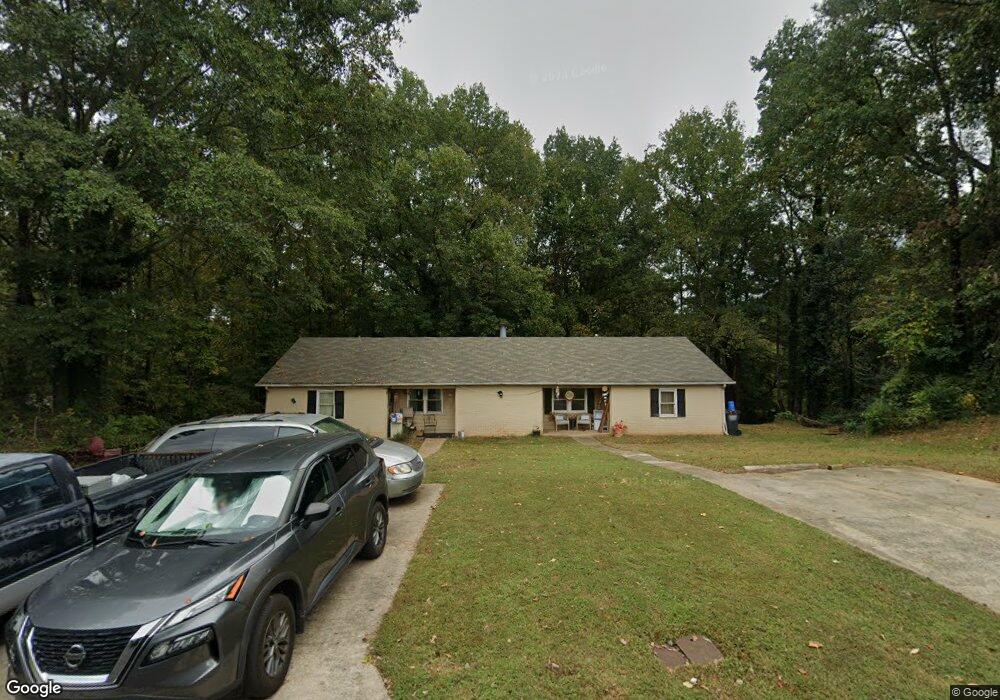
101 River Pointe Ct SW Lilburn, GA 30047
Estimated Value: $349,000 - $455,000
4
Beds
4
Baths
1,878
Sq Ft
$212/Sq Ft
Est. Value
About This Home
This home is located at 101 River Pointe Ct SW, Lilburn, GA 30047 and is currently estimated at $398,058, approximately $211 per square foot. 101 River Pointe Ct SW is a home located in Gwinnett County with nearby schools including Knight Elementary School, Trickum Middle School, and Parkview High School.
Ownership History
Date
Name
Owned For
Owner Type
Purchase Details
Closed on
Sep 23, 2016
Sold by
Barrlee Properties Llc
Bought by
Garcia Ana and Hernandez Braulio Garcia
Current Estimated Value
Home Financials for this Owner
Home Financials are based on the most recent Mortgage that was taken out on this home.
Original Mortgage
$130,500
Outstanding Balance
$62,127
Interest Rate
4.5%
Mortgage Type
New Conventional
Estimated Equity
$335,931
Purchase Details
Closed on
Mar 26, 2013
Sold by
Barr Lee Mink
Bought by
Barrlee Properties Llc
Purchase Details
Closed on
Sep 22, 2011
Sold by
Ace Homes
Bought by
Mink-Barr Lee and Barr Douglas H
Purchase Details
Closed on
Oct 26, 1999
Sold by
Cabrera Priamo F
Bought by
Radulea Hendel
Home Financials for this Owner
Home Financials are based on the most recent Mortgage that was taken out on this home.
Original Mortgage
$88,000
Interest Rate
7.81%
Mortgage Type
New Conventional
Create a Home Valuation Report for This Property
The Home Valuation Report is an in-depth analysis detailing your home's value as well as a comparison with similar homes in the area
Home Values in the Area
Average Home Value in this Area
Purchase History
| Date | Buyer | Sale Price | Title Company |
|---|---|---|---|
| Garcia Ana | $145,000 | -- | |
| Barrlee Properties Llc | -- | -- | |
| Mink-Barr Lee | $70,500 | -- | |
| Radulea Hendel | $110,000 | -- |
Source: Public Records
Mortgage History
| Date | Status | Borrower | Loan Amount |
|---|---|---|---|
| Open | Garcia Ana | $130,500 | |
| Previous Owner | Radulea Hendel | $88,000 |
Source: Public Records
Tax History Compared to Growth
Tax History
| Year | Tax Paid | Tax Assessment Tax Assessment Total Assessment is a certain percentage of the fair market value that is determined by local assessors to be the total taxable value of land and additions on the property. | Land | Improvement |
|---|---|---|---|---|
| 2025 | $4,096 | $149,440 | $20,000 | $129,440 |
| 2024 | $3,868 | $132,120 | $20,000 | $112,120 |
| 2023 | $3,868 | $126,280 | $29,200 | $97,080 |
| 2022 | $2,830 | $86,400 | $16,000 | $70,400 |
| 2021 | $2,845 | $86,400 | $16,000 | $70,400 |
| 2020 | $2,572 | $73,040 | $16,000 | $57,040 |
| 2019 | $2,514 | $73,040 | $16,000 | $57,040 |
| 2018 | $2,274 | $62,560 | $12,800 | $49,760 |
| 2016 | $2,090 | $42,680 | $9,200 | $33,480 |
| 2015 | $2,106 | $42,680 | $9,200 | $33,480 |
| 2014 | $1,597 | $28,200 | $10,000 | $18,200 |
Source: Public Records
Map
Nearby Homes
- 234 Shadow Lake Dr SW
- 495 Tambec Trace NW Unit 2
- 312 Westminister Ln SW
- 3900 Safehaven Dr
- 4239 River Branch Way
- 156 Round Pond Dr
- 4080 Landress Park Dr NW Unit 1
- 4005 Leeambur Ct NW
- 246 Round Pond Dr
- 87 Valley Rd
- 287 Willow Cove Ct
- 4160 Tillrock Ln
- 4181 Tillrock Ln
- 167 Lester Rd SW Unit 1
- 106 Valley Rd
- 290 Jackson Place NW
- 445 Bruce Way SW
- 4112 Bowers Pointe Dr SW Unit Home Away From Home
- 111 River Pointe Ct SW
- 4091 Bowers Pointe Dr SW Unit 1
- 102 River Pointe Ct SW Unit 1
- 4110 Bowers Pointe Dr SW
- 4082 Bowers Pointe Dr SW
- 121 River Pointe Ct SW
- 121 River Pointe Ct SW Unit B
- 121 River Pointe Ct SW
- 4100 Bowers Pointe Dr SW
- 123 River Pointe Ct SW
- 123 River Pointe Ct SW
- 4120 Bowers Pointe Dr SW
- 110 River Pointe Ct SW Unit 1
- 4081 Bowers Pointe Dr SW
- 4131 Bowers Pointe Dr SW
- 4090 Bowers Pointe Dr SW
- 131 River Pointe Ct SW Unit 1
- 4182 Bowers Pointe Dr SW
- 4130 Bowers Pointe Dr SW