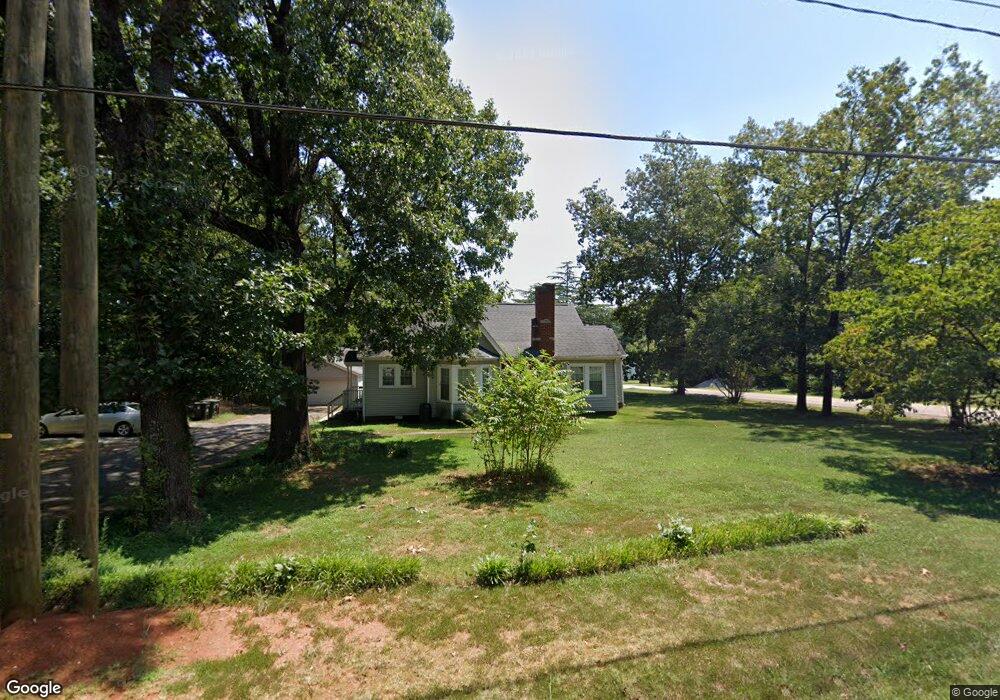
101 Roberta Rd SW Concord, NC 28027
Estimated Value: $241,000 - $271,000
1
Bed
1
Bath
1,302
Sq Ft
$196/Sq Ft
Est. Value
About This Home
This home is located at 101 Roberta Rd SW, Concord, NC 28027 and is currently estimated at $255,125, approximately $195 per square foot. 101 Roberta Rd SW is a home located in Cabarrus County with nearby schools including Wolf Meadow Elementary School, J.N. Fries Middle School, and Branch Christian Academy.
Ownership History
Date
Name
Owned For
Owner Type
Purchase Details
Closed on
Aug 3, 2009
Sold by
Federal National Mortgage Association
Bought by
Hinson Ronnie L and Hinson Regina F
Current Estimated Value
Purchase Details
Closed on
Dec 2, 2008
Sold by
Potts Joanne C
Bought by
Federal National Mortgage Association
Purchase Details
Closed on
Oct 19, 2007
Sold by
Fannie Mae
Bought by
Baker Rebecca Laraine Potts
Purchase Details
Closed on
Sep 17, 2007
Sold by
Potts Joanne C
Bought by
Federal National Mortgage Association
Purchase Details
Closed on
Nov 2, 2005
Sold by
Ford Lauren Potts and Ford Clifford Wayne
Bought by
Baker Rebecca Laraine Potts
Create a Home Valuation Report for This Property
The Home Valuation Report is an in-depth analysis detailing your home's value as well as a comparison with similar homes in the area
Home Values in the Area
Average Home Value in this Area
Purchase History
| Date | Buyer | Sale Price | Title Company |
|---|---|---|---|
| Hinson Ronnie L | -- | None Available | |
| Federal National Mortgage Association | $119,216 | None Available | |
| Baker Rebecca Laraine Potts | $106,772 | None Available | |
| Federal National Mortgage Association | $106,772 | None Available | |
| Baker Rebecca Laraine Potts | -- | -- |
Source: Public Records
Tax History Compared to Growth
Tax History
| Year | Tax Paid | Tax Assessment Tax Assessment Total Assessment is a certain percentage of the fair market value that is determined by local assessors to be the total taxable value of land and additions on the property. | Land | Improvement |
|---|---|---|---|---|
| 2025 | $2,289 | $229,800 | $75,000 | $154,800 |
| 2024 | $2,289 | $229,800 | $75,000 | $154,800 |
| 2023 | $1,691 | $138,600 | $45,000 | $93,600 |
| 2022 | $1,745 | $143,040 | $45,000 | $98,040 |
| 2021 | $1,745 | $143,040 | $45,000 | $98,040 |
| 2020 | $1,745 | $143,040 | $45,000 | $98,040 |
| 2019 | $1,401 | $114,840 | $33,000 | $81,840 |
| 2018 | $1,378 | $114,840 | $33,000 | $81,840 |
| 2017 | $1,355 | $114,840 | $33,000 | $81,840 |
| 2016 | $804 | $113,390 | $33,000 | $80,390 |
| 2015 | $1,338 | $113,390 | $33,000 | $80,390 |
| 2014 | $1,338 | $113,390 | $33,000 | $80,390 |
Source: Public Records
Map
Nearby Homes
- 668 Jackson Terrace SW
- 664 Jackson Terrace SW
- 1067 Old Charlotte Rd
- 933 Old Charlotte Rd
- 220 Highland Ave SW
- 207 Highland Ave SW
- 82 Highland Ave SW
- 84 Highland Ave SW
- Lot #2 Faith Dr SW
- 1255 Old Charlotte Rd
- 809 Fargo Dr SW
- 782 Chalice St SW
- 1022 Van Gogh Dr SW
- 609 Faith Dr SW Unit 1
- 41 Fleetwood Dr SW
- 1030 Van Gogh Dr SW
- 758 Main St SW
- 1015 Rockland Cir SW
- 2893 Signal Ct SW
- 64 Robinson Dr SW
- 99 Roberta Rd SW
- 74 Park Dr SW
- 97 Roberta Rd SW
- 105 Roberta Rd SW
- 95 Roberta Rd SW
- 81 Alpha Ct SW
- 80 Alpha Ct SW
- 75 Park Dr SW
- 93 Roberta Rd SW
- 107 Roberta Rd SW
- 73 Park Dr SW
- 72 Park Dr SW
- 91 Roberta Rd SW
- 71 Pinecrest Dr SW
- 71 Park Dr SW
- 109 Roberta Rd SW
- 69 Pinecrest Dr SW
- 70 Park Dr SW
- 584 Love St SW
- 67 Pinecrest Dr SW