Estimated Value: $642,518 - $707,000
--
Bed
3
Baths
2,431
Sq Ft
$273/Sq Ft
Est. Value
About This Home
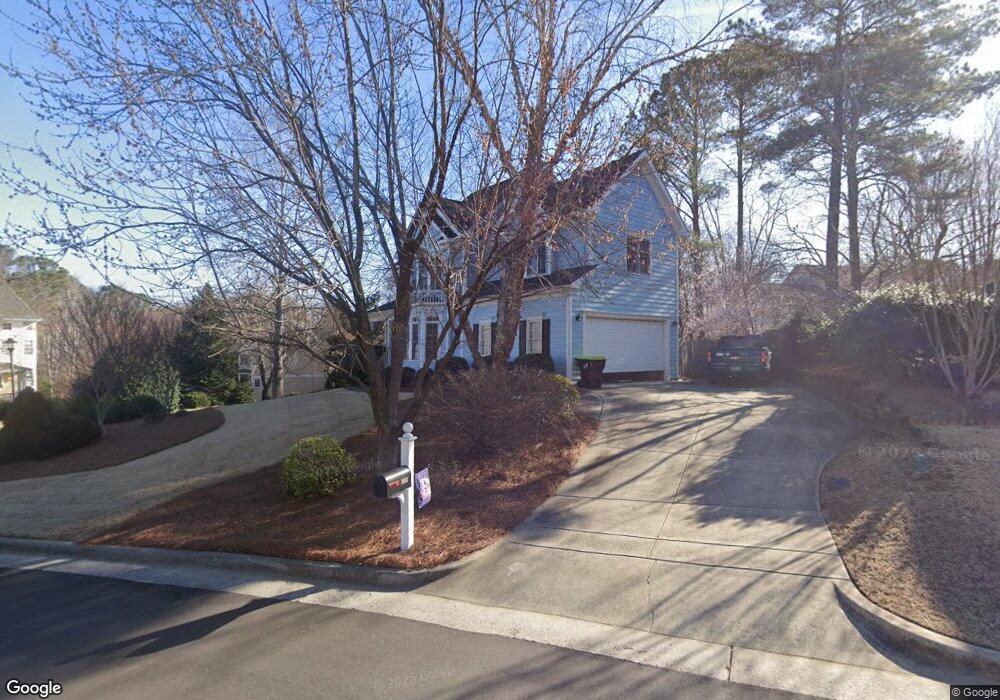
This home is located at 101 Rushing Breeze Ct, Apex, NC 27502 and is currently estimated at $663,380, approximately $272 per square foot. 101 Rushing Breeze Ct is a home located in Wake County with nearby schools including Scotts Ridge Elementary School, Apex Middle, and Apex High School.
Ownership History
Date
Name
Owned For
Owner Type
Purchase Details
Closed on
Jan 10, 2002
Sold by
Biltmore Homes Llc
Bought by
Nicklis Stephen Gregory and Nickliss Lisa Ann
Current Estimated Value
Home Financials for this Owner
Home Financials are based on the most recent Mortgage that was taken out on this home.
Original Mortgage
$197,580
Outstanding Balance
$81,314
Interest Rate
7.14%
Estimated Equity
$582,066
Purchase Details
Closed on
Oct 6, 2000
Sold by
Stratford Woods Llc
Bought by
Biltmore Homes Llc
Home Financials for this Owner
Home Financials are based on the most recent Mortgage that was taken out on this home.
Original Mortgage
$100,125
Interest Rate
7.97%
Create a Home Valuation Report for This Property
The Home Valuation Report is an in-depth analysis detailing your home's value as well as a comparison with similar homes in the area
Home Values in the Area
Average Home Value in this Area
Purchase History
| Date | Buyer | Sale Price | Title Company |
|---|---|---|---|
| Nicklis Stephen Gregory | $247,000 | -- | |
| Biltmore Homes Llc | $133,500 | -- |
Source: Public Records
Mortgage History
| Date | Status | Borrower | Loan Amount |
|---|---|---|---|
| Open | Nicklis Stephen Gregory | $197,580 | |
| Previous Owner | Biltmore Homes Llc | $100,125 | |
| Closed | Nicklis Stephen Gregory | $31,500 |
Source: Public Records
Tax History Compared to Growth
Tax History
| Year | Tax Paid | Tax Assessment Tax Assessment Total Assessment is a certain percentage of the fair market value that is determined by local assessors to be the total taxable value of land and additions on the property. | Land | Improvement |
|---|---|---|---|---|
| 2025 | $5,548 | $633,169 | $189,000 | $444,169 |
| 2024 | $5,424 | $633,169 | $189,000 | $444,169 |
| 2023 | $3,938 | $357,116 | $80,000 | $277,116 |
| 2022 | $3,697 | $357,116 | $80,000 | $277,116 |
| 2021 | $3,555 | $357,116 | $80,000 | $277,116 |
| 2020 | $3,520 | $357,116 | $80,000 | $277,116 |
| 2019 | $3,313 | $289,987 | $80,000 | $209,987 |
| 2018 | $3,121 | $289,987 | $80,000 | $209,987 |
| 2017 | $2,905 | $289,987 | $80,000 | $209,987 |
| 2016 | $2,863 | $289,987 | $80,000 | $209,987 |
| 2015 | $2,770 | $273,780 | $62,000 | $211,780 |
| 2014 | -- | $273,780 | $62,000 | $211,780 |
Source: Public Records
Map
Nearby Homes
- 1706 Patterson Grove Rd
- 104 Pine Tag Ct
- 1311 Pendula Path
- 1131 Bungalow Park Dr
- 1042 Mica Lamp Ct
- 1004 Wild Sonnet Ct
- 3014 Silky Dogwood Trail
- 1002 Tribble Gate Ct
- 402 Village Loop Dr
- 428 Heritage Village Ln
- 441 Heritage Village Ln
- 2117 Barrier Ridge Way Unit Lot 24
- 2008 Silky Dogwood Trail
- 2113 Barrier Ridge Way Unit Lot 26
- 448 Heritage Village Ln
- 2120 Barrier Ridge Way Unit Lot 36
- 1127 Palisade Bluff Ln
- 1773 Town Home Dr
- 460 Heritage Village Ln
- 2112 Barrier Ridge Way Unit Lot 34
- 105 Rushing Breeze Ct
- 113 Cedar Wynd Dr
- 101 Hawkscrest Ct
- 301 Cedar Wynd Dr
- 109 Rushing Breeze Ct
- 109 Cedar Wynd Dr
- 204 Cedar Wynd Dr
- 100 Hawkscrest Ct
- 300 Cedar Wynd Dr
- 105 Hawkscrest Ct
- 108 Rushing Breeze Ct
- 303 Cedar Wynd Dr
- 105 Cedar Wynd Dr
- 104 Willow Knoll Ct
- 111 Rushing Breeze Ct
- 112 Cedar Wynd Dr
- 106 Hawkscrest Ct
- 302 Cedar Wynd Dr
- 103 Willow Knoll Ct
- 109 Hawkscrest Ct