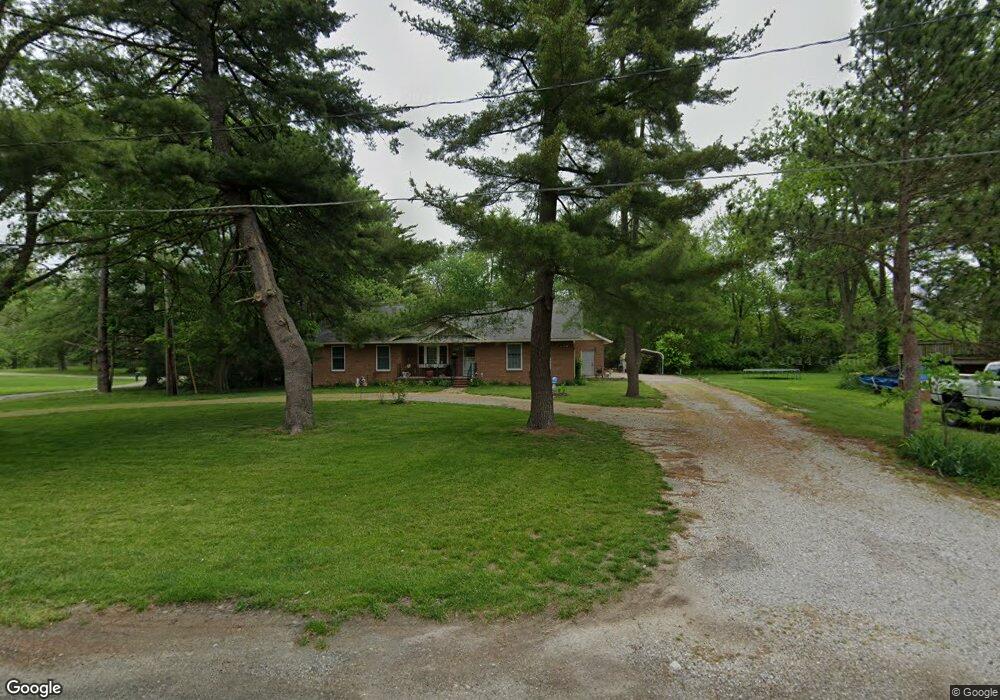
101 S Pitts St Freeburg, IL 62243
Estimated Value: $286,000 - $321,000
--
Bed
--
Bath
1,840
Sq Ft
$165/Sq Ft
Est. Value
About This Home
This home is located at 101 S Pitts St, Freeburg, IL 62243 and is currently estimated at $304,344, approximately $165 per square foot. 101 S Pitts St is a home located in St. Clair County with nearby schools including Freeburg Elementary School, Freeburg Community High School, and St. Joseph Catholic School.
Ownership History
Date
Name
Owned For
Owner Type
Purchase Details
Closed on
Sep 7, 2023
Sold by
Groth Terry and Groth Patricia
Bought by
Parrish Real Properties Llc
Current Estimated Value
Home Financials for this Owner
Home Financials are based on the most recent Mortgage that was taken out on this home.
Original Mortgage
$184,000
Outstanding Balance
$180,053
Interest Rate
6.9%
Mortgage Type
Purchase Money Mortgage
Estimated Equity
$124,291
Purchase Details
Closed on
Apr 15, 2011
Sold by
Mitchell Keith A
Bought by
Groth Terry and Groth Patricia
Home Financials for this Owner
Home Financials are based on the most recent Mortgage that was taken out on this home.
Original Mortgage
$180,000
Interest Rate
4.77%
Mortgage Type
New Conventional
Purchase Details
Closed on
Jan 14, 2010
Sold by
Mitchell Lloyd C and Mitchell Joyce V
Bought by
Mitchell Keith A and Lloyd C Mitchell Family Trust
Purchase Details
Closed on
May 10, 2002
Sold by
Corcoran Larry and Corcoran Margaret
Bought by
Mitchell Lloyd C and Mitchell Joyce
Create a Home Valuation Report for This Property
The Home Valuation Report is an in-depth analysis detailing your home's value as well as a comparison with similar homes in the area
Home Values in the Area
Average Home Value in this Area
Purchase History
| Date | Buyer | Sale Price | Title Company |
|---|---|---|---|
| Parrish Real Properties Llc | $184,000 | None Available | |
| Groth Terry | $180,000 | Metro East Title Corporation | |
| Mitchell Keith A | -- | None Available | |
| Mitchell Lloyd C | $44,000 | Metro East Title |
Source: Public Records
Mortgage History
| Date | Status | Borrower | Loan Amount |
|---|---|---|---|
| Open | Parrish Real Properties Llc | $184,000 | |
| Closed | Groth Terry | $180,000 |
Source: Public Records
Tax History Compared to Growth
Tax History
| Year | Tax Paid | Tax Assessment Tax Assessment Total Assessment is a certain percentage of the fair market value that is determined by local assessors to be the total taxable value of land and additions on the property. | Land | Improvement |
|---|---|---|---|---|
| 2024 | $4,404 | $85,540 | $16,997 | $68,543 |
| 2023 | $4,466 | $81,574 | $6,282 | $75,292 |
| 2022 | $4,565 | $76,437 | $5,886 | $70,551 |
| 2021 | $4,697 | $71,961 | $5,541 | $66,420 |
| 2020 | $4,666 | $65,466 | $5,041 | $60,425 |
| 2019 | $4,729 | $69,453 | $5,209 | $64,244 |
| 2018 | $4,713 | $68,535 | $5,140 | $63,395 |
| 2017 | $4,670 | $65,528 | $4,915 | $60,613 |
| 2016 | $4,658 | $62,803 | $4,711 | $58,092 |
| 2014 | $2,180 | $64,243 | $4,834 | $59,409 |
| 2013 | $3,010 | $63,670 | $4,791 | $58,879 |
Source: Public Records
Map
Nearby Homes
- 106 S Vine St
- 207 N Edison St
- 3 Park St
- 401 N Edison St
- 312 W Phillips St
- 206 N Main St
- 520 N Edison St
- 302 N Railroad St
- 103 Draco Dr
- 0 Hickory Dr
- 109 Willow Dr
- 111 Willow Dr
- 420 Foxtail Dr
- 440 Foxtail Dr
- 433 Foxtail Dr
- 304 Torrington Ln
- 359 Sleeping Indian Dr
- 363 Sleeping Indian Dr
- 222 Alamosa Dr
- 227 Alamosa Dr
- 105 S Pitts St
- 313 E High St
- 5418 State Route 159
- 312 E High St
- 111 S Pitts St
- 106 S Pitts St
- 307 E High St
- 112 S Pitts St
- 401 E High St
- 405 E High St
- 101 S Vine St
- 105 S Vine St
- 312 E Washington St
- 312 E Washington St
- 1 S Vine St
- 111 S Vine St
- 301 E High St
- 407 Cemetery Rd
- 5 S Vine St
- 417 Cemetery Rd