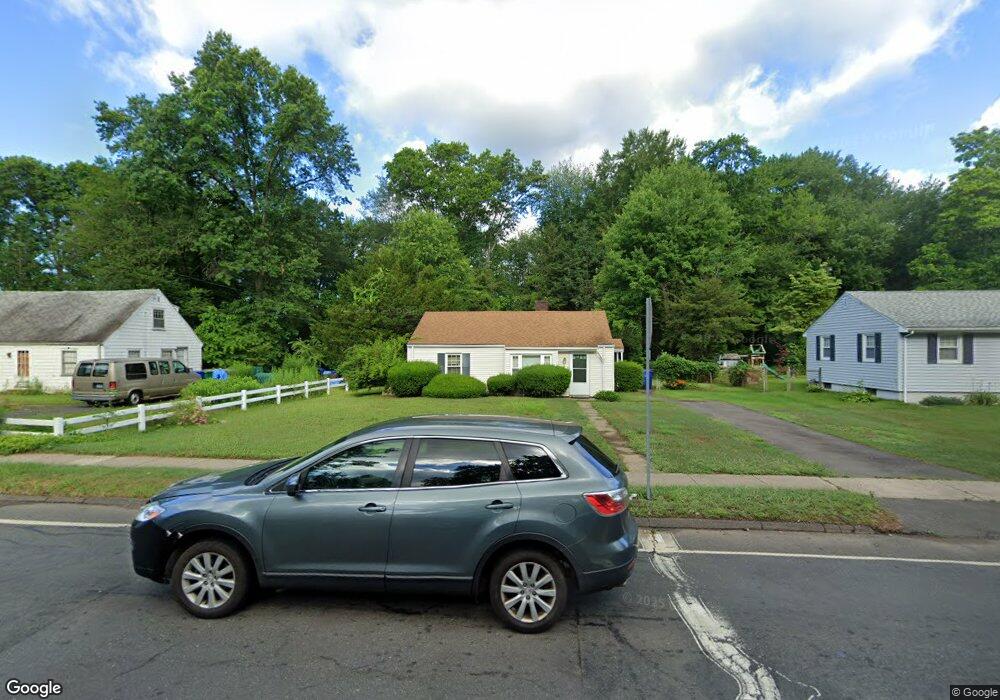
101 School St Bloomfield, CT 06002
Estimated Value: $185,000 - $267,000
2
Beds
1
Bath
768
Sq Ft
$295/Sq Ft
Est. Value
About This Home
This home is located at 101 School St, Bloomfield, CT 06002 and is currently estimated at $226,659, approximately $295 per square foot. 101 School St is a home located in Hartford County with nearby schools including Metacomet School, Carmen Arace Intermediate School, and Laurel School.
Ownership History
Date
Name
Owned For
Owner Type
Purchase Details
Closed on
Aug 31, 2009
Sold by
Laplante Robert
Bought by
Foster Dean
Current Estimated Value
Home Financials for this Owner
Home Financials are based on the most recent Mortgage that was taken out on this home.
Original Mortgage
$108,989
Outstanding Balance
$71,206
Interest Rate
5.17%
Mortgage Type
Purchase Money Mortgage
Estimated Equity
$155,453
Purchase Details
Closed on
Aug 30, 2004
Sold by
Drakey Barbara and Drakey George
Bought by
Laplante Robert
Home Financials for this Owner
Home Financials are based on the most recent Mortgage that was taken out on this home.
Original Mortgage
$95,200
Interest Rate
6.02%
Mortgage Type
Purchase Money Mortgage
Purchase Details
Closed on
Mar 31, 1997
Sold by
Richardson Philip and Richardson Donna
Bought by
Drakey David
Create a Home Valuation Report for This Property
The Home Valuation Report is an in-depth analysis detailing your home's value as well as a comparison with similar homes in the area
Home Values in the Area
Average Home Value in this Area
Purchase History
We collect this data history from publicly available records. To have your information removed, we recommend requesting removal directly through your county’s website.
| Date | Buyer | Sale Price | Title Company |
|---|---|---|---|
| Foster Dean | $111,000 | -- | |
| Foster Dean | $111,000 | -- | |
| Laplante Robert | $119,000 | -- | |
| Laplante Robert | $119,000 | -- | |
| Drakey David | $53,800 | -- | |
| Drakey David | $53,800 | -- |
Source: Public Records
Mortgage History
We collect this data history from publicly available records. To have your information removed, we recommend requesting removal directly through your county’s website.
| Date | Status | Borrower | Loan Amount |
|---|---|---|---|
| Open | Drakey David | $108,989 | |
| Closed | Drakey David | $108,989 | |
| Previous Owner | Drakey David | $95,200 |
Source: Public Records
Tax History
| Year | Tax Paid | Tax Assessment Tax Assessment Total Assessment is a certain percentage of the fair market value that is determined by local assessors to be the total taxable value of land and additions on the property. | Land | Improvement |
|---|---|---|---|---|
| 2025 | $4,754 | $122,710 | $34,790 | $87,920 |
| 2024 | $3,097 | $76,300 | $30,870 | $45,430 |
| 2023 | $3,043 | $76,300 | $30,870 | $45,430 |
| 2022 | $2,825 | $76,300 | $30,870 | $45,430 |
| 2021 | $2,906 | $76,300 | $30,870 | $45,430 |
| 2020 | $2,862 | $76,300 | $30,870 | $45,430 |
| 2019 | $3,049 | $76,300 | $30,870 | $45,430 |
| 2018 | $2,695 | $67,340 | $30,870 | $36,470 |
| 2017 | $2,698 | $67,340 | $30,870 | $36,470 |
| 2016 | $2,636 | $67,340 | $30,870 | $36,470 |
| 2015 | $2,593 | $67,340 | $30,870 | $36,470 |
| 2014 | $2,914 | $78,050 | $40,110 | $37,940 |
Source: Public Records
Map
Nearby Homes
- 157 School St
- 256 Park Ave
- 14 Emerson St
- 140 Cottage Grove Rd
- 5 Arlington St
- 40 Cottage Grove Cir
- 18 Walsh St
- 3 Camelot Dr Unit 2
- 1130 Blue Hills Ave
- 180 Brookline Ave
- 110 Darby St
- 18 Darby St
- 79 Prospect St
- 2 Sandra Dr
- 32 Brentwood Dr
- 28 Prospect St
- 26 Euclid St W
- 12 Filley St
- 14 Filley St
- 57 Burnham St
Your Personal Tour Guide
Ask me questions while you tour the home.