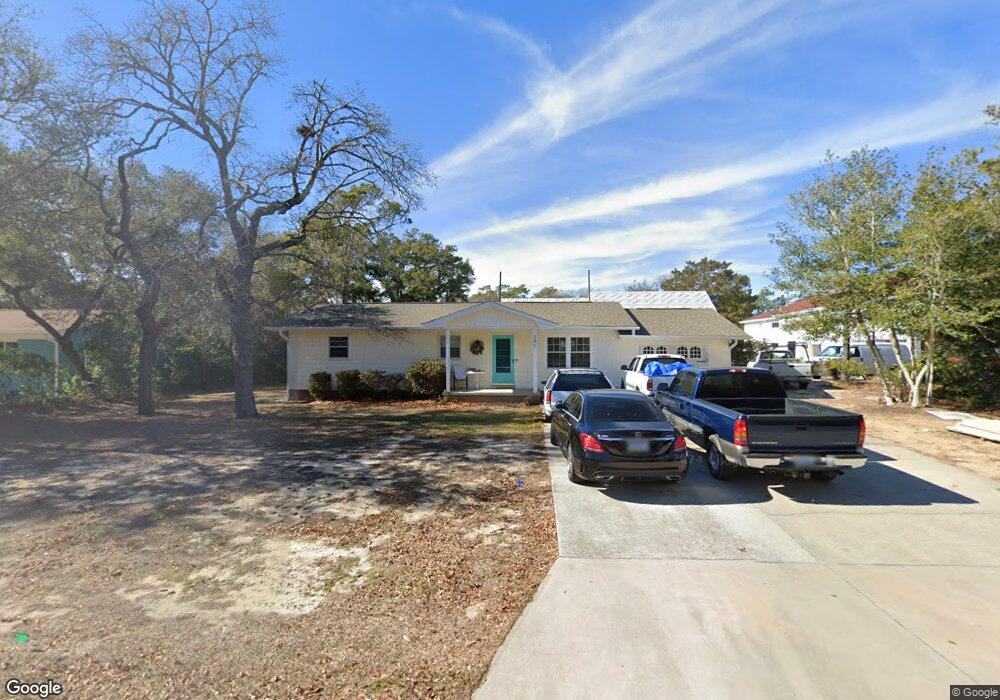
101 SE 2nd Oak Island, NC 28465
Estimated Value: $429,000 - $508,514
3
Beds
2
Baths
1,100
Sq Ft
$427/Sq Ft
Est. Value
About This Home
This home is located at 101 SE 2nd, Oak Island, NC 28465 and is currently estimated at $469,629, approximately $426 per square foot. 101 SE 2nd is a home located in Brunswick County with nearby schools including Southport Elementary School, South Brunswick Middle School, and South Brunswick High School.
Ownership History
Date
Name
Owned For
Owner Type
Purchase Details
Closed on
Jan 21, 2014
Sold by
Federal Home Loan Mortgage Corporation
Bought by
Arvidson Eric Paul and The Arvidson Solo 401 K Trust
Current Estimated Value
Purchase Details
Closed on
Jan 10, 2013
Sold by
Keesee Brian K and Keesee Kimberly M
Bought by
Federal Home Loan Mortgage Corporation
Purchase Details
Closed on
Jul 29, 2005
Sold by
Brian Keith Keesee Construction Inc
Bought by
Keesee Brian Keith and Keesee Kimberly Marie
Purchase Details
Closed on
Mar 21, 2005
Sold by
Lawing Robert Avery and Lawing Tina J
Bought by
Brian Keith Keeseeconstruction Inc
Create a Home Valuation Report for This Property
The Home Valuation Report is an in-depth analysis detailing your home's value as well as a comparison with similar homes in the area
Home Values in the Area
Average Home Value in this Area
Purchase History
| Date | Buyer | Sale Price | Title Company |
|---|---|---|---|
| Arvidson Eric Paul | -- | None Available | |
| Federal Home Loan Mortgage Corporation | $107,972 | None Available | |
| Keesee Brian Keith | -- | None Available | |
| Brian Keith Keeseeconstruction Inc | $225,000 | None Available |
Source: Public Records
Tax History Compared to Growth
Tax History
| Year | Tax Paid | Tax Assessment Tax Assessment Total Assessment is a certain percentage of the fair market value that is determined by local assessors to be the total taxable value of land and additions on the property. | Land | Improvement |
|---|---|---|---|---|
| 2025 | -- | $476,570 | $217,500 | $259,070 |
| 2024 | $1,764 | $409,320 | $217,500 | $191,820 |
| 2023 | $1,198 | $409,320 | $217,500 | $191,820 |
| 2022 | $0 | $193,930 | $103,500 | $90,430 |
| 2021 | $1,143 | $193,930 | $103,500 | $90,430 |
| 2020 | $1,143 | $193,930 | $103,500 | $90,430 |
| 2019 | $1,143 | $104,550 | $103,500 | $1,050 |
| 2018 | $891 | $56,550 | $55,500 | $1,050 |
| 2017 | $891 | $56,550 | $55,500 | $1,050 |
| 2016 | $866 | $56,550 | $55,500 | $1,050 |
| 2015 | $866 | $145,890 | $55,500 | $90,390 |
| 2014 | $744 | $133,377 | $67,500 | $65,877 |
Source: Public Records
Map
Nearby Homes