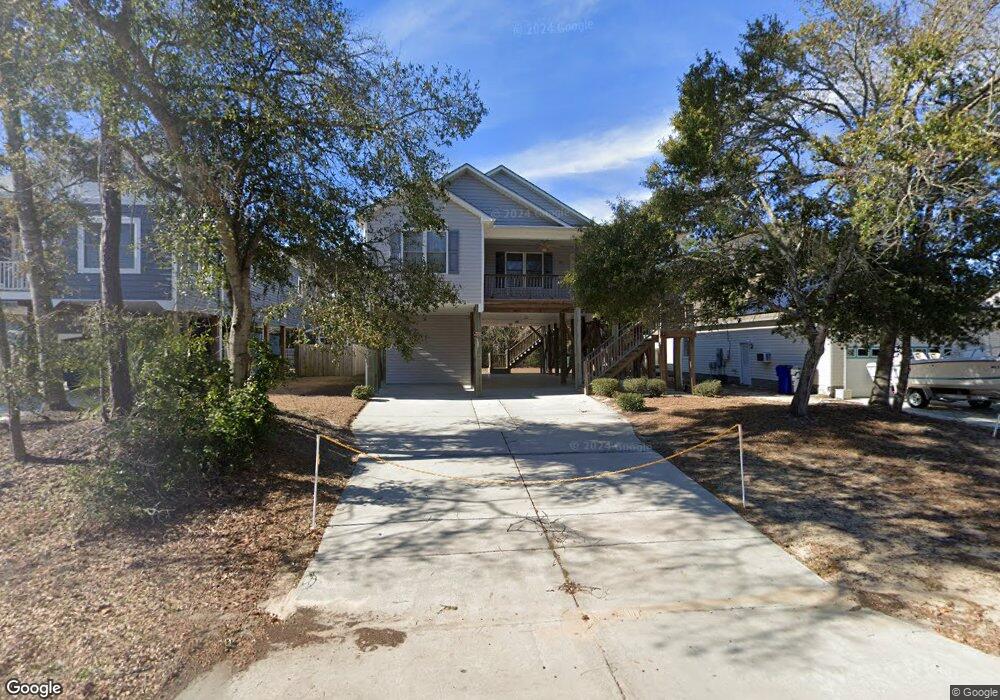
101 SE 3rd St Oak Island, NC 28465
Estimated Value: $551,000 - $565,000
3
Beds
2
Baths
1,283
Sq Ft
$435/Sq Ft
Est. Value
About This Home
This home is located at 101 SE 3rd St, Oak Island, NC 28465 and is currently estimated at $557,775, approximately $434 per square foot. 101 SE 3rd St is a home located in Brunswick County with nearby schools including Southport Elementary School, South Brunswick Middle School, and South Brunswick High School.
Ownership History
Date
Name
Owned For
Owner Type
Purchase Details
Closed on
Mar 3, 2025
Sold by
Vickers Sidney G and Vickers Catherine K
Bought by
Vickers Sidney Gordon and Roberts Margaret Beth
Current Estimated Value
Purchase Details
Closed on
Aug 8, 2008
Sold by
Rominger Margaret Beth and Rominger Danny
Bought by
Vickers Sidney G and Vickers Catherine K
Purchase Details
Closed on
Apr 18, 2007
Sold by
Blake Home Builders Inc
Bought by
Vickers Sidney G and Vickers Margaret Beth
Create a Home Valuation Report for This Property
The Home Valuation Report is an in-depth analysis detailing your home's value as well as a comparison with similar homes in the area
Home Values in the Area
Average Home Value in this Area
Purchase History
| Date | Buyer | Sale Price | Title Company |
|---|---|---|---|
| Vickers Sidney Gordon | -- | None Listed On Document | |
| Vickers Sidney Gordon | -- | None Listed On Document | |
| Vickers Sidney G | -- | None Available | |
| Vickers Sidney G | $295,000 | None Available |
Source: Public Records
Tax History Compared to Growth
Tax History
| Year | Tax Paid | Tax Assessment Tax Assessment Total Assessment is a certain percentage of the fair market value that is determined by local assessors to be the total taxable value of land and additions on the property. | Land | Improvement |
|---|---|---|---|---|
| 2025 | $2,101 | $497,570 | $145,000 | $352,570 |
| 2024 | $2,101 | $497,570 | $145,000 | $352,570 |
| 2023 | $1,479 | $497,570 | $145,000 | $352,570 |
| 2022 | $1,479 | $247,480 | $69,000 | $178,480 |
| 2021 | $1,449 | $247,480 | $69,000 | $178,480 |
| 2020 | $1,424 | $247,480 | $69,000 | $178,480 |
| 2019 | $1,424 | $72,810 | $69,000 | $3,810 |
| 2018 | $1,247 | $41,550 | $37,000 | $4,550 |
| 2017 | $1,247 | $41,550 | $37,000 | $4,550 |
| 2016 | $1,222 | $41,550 | $37,000 | $4,550 |
| 2015 | $1,222 | $213,750 | $37,000 | $176,750 |
| 2014 | $978 | $181,941 | $45,000 | $136,941 |
Source: Public Records
Map
Nearby Homes