J
Seller's Agent in 2012
John Julius
Today Real Estate
(508) 237-2700
4 Total Sales


Estimated Value: $664,746 - $742,000
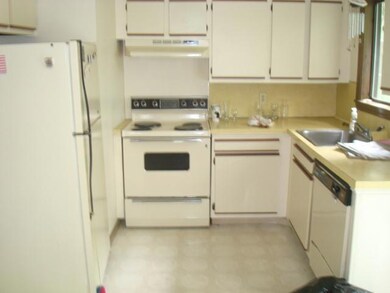
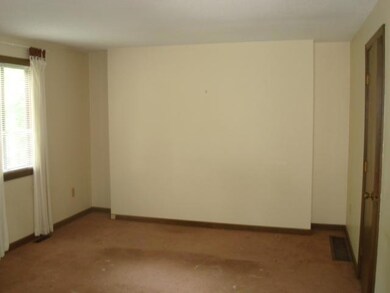
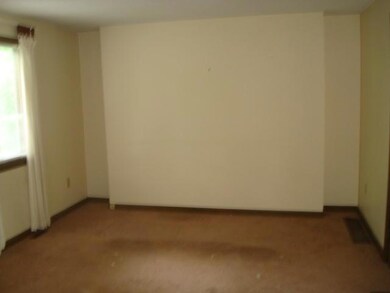
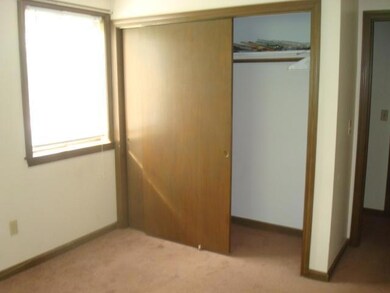
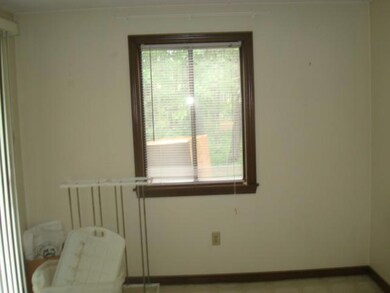
Not your typical duplex. Nestled amongst the trees down a dirt road you will discover a saltbox style duplex built for privacy. Each unit offers 2 bedrooms with separate basements and separate utilities. Any and all costs associated with buyer's lenders appraisal to include any necessary repairs will be paid for by the buyer and NOT the seller. Sold As Is. Tenant in residenceP&S & seller addendum must be signed within 2-3 days of accepted offer. Buyer has 5-7 days for inspections. Earnest money for FHA loans must be 3.5% and 10% for Cash offers via bank check at time of P&S.
| Date | Buyer | Sale Price | Title Company |
|---|---|---|---|
| Federal National Mortgage Association | $283,500 | -- |
| Date | Status | Borrower | Loan Amount |
|---|---|---|---|
| Open | Roncelli Valmor L | $438,000 | |
| Closed | Clabby Lillian H | $178,500 | |
| Closed | Clabby Lillian H | $170,625 | |
| Previous Owner | Lebeau Lillian E | $348,000 | |
| Previous Owner | Lebeau Lillian E | $65,000 | |
| Previous Owner | Lebeau Lillian E | $335,000 | |
| Previous Owner | Lebeau Lillian E | $25,000 | |
| Previous Owner | Lebeau Gary E | $310,000 | |
| Previous Owner | Lebeau Gary E | $155,000 | |
| Previous Owner | Lebeau Gary E | $78,500 |
| Date | Event | Price | Change | Sq Ft Price |
|---|---|---|---|---|
| 03/28/2012 03/28/12 | Sold | $227,500 | -7.1% | $125 / Sq Ft |
| 02/27/2012 02/27/12 | Pending | -- | -- | -- |
| 11/04/2011 11/04/11 | For Sale | $244,900 | -- | $135 / Sq Ft |
| Year | Tax Paid | Tax Assessment Tax Assessment Total Assessment is a certain percentage of the fair market value that is determined by local assessors to be the total taxable value of land and additions on the property. | Land | Improvement |
|---|---|---|---|---|
| 2025 | $2,496 | $576,500 | $209,300 | $367,200 |
| 2024 | $2,221 | $506,000 | $170,500 | $335,500 |
| 2023 | $2,149 | $460,200 | $155,000 | $305,200 |
| 2022 | $2,167 | $386,900 | $155,100 | $231,800 |
| 2021 | $2,257 | $374,300 | $152,000 | $222,300 |
| 2020 | $1,918 | $314,400 | $152,000 | $162,400 |
| 2019 | $1,990 | $322,600 | $164,000 | $158,600 |
| 2018 | $1,862 | $293,700 | $141,900 | $151,800 |
| 2017 | $1,806 | $293,700 | $141,900 | $151,800 |
| 2016 | $1,903 | $291,400 | $149,000 | $142,400 |
| 2015 | $1,865 | $291,400 | $149,000 | $142,400 |
| 2014 | $1,715 | $270,100 | $127,700 | $142,400 |
J
Seller's Agent in 2012
John Julius
Today Real Estate
(508) 237-2700
4 Total Sales

Buyer's Agent in 2012
Margo Pisacano
Margo & Company
(508) 776-5508
3 in this area
87 Total Sales
Source: Cape Cod & Islands Association of REALTORS®
MLS Number: 21109745
APN: DENN-000212-000000-000067
Disclaimer: Certain information contained herein is derived from information provided by parties other than Homes.com. All information provided is deemed reliable, but is not guaranteed to be accurate and should be independently verified.
![]() All data relating to real estate for sale on this page comes from the Broker Reciprocity (BR) of the Cape Cod & Islands Multiple Listing Service, Inc. Detailed information about real estate listings held by brokerage firms other than CC&I Assoc. of REALTORS®, Inc. includes the name of the listing company. Neither the listing company nor CC&I Assoc. of REALTORS®, Inc. shall be responsible for any typographical errors, misinformation, misprints and shall be held totally harmless. The Broker providing this data believes it to be correct, but advises interested parties to confirm any item before relying on it in a purchase decision. All properties are subject to prior sale, changes, or withdrawal. Copyright 2025 © Cape Cod & Islands Multiple Listing Service, Inc. All rights reserved.
All data relating to real estate for sale on this page comes from the Broker Reciprocity (BR) of the Cape Cod & Islands Multiple Listing Service, Inc. Detailed information about real estate listings held by brokerage firms other than CC&I Assoc. of REALTORS®, Inc. includes the name of the listing company. Neither the listing company nor CC&I Assoc. of REALTORS®, Inc. shall be responsible for any typographical errors, misinformation, misprints and shall be held totally harmless. The Broker providing this data believes it to be correct, but advises interested parties to confirm any item before relying on it in a purchase decision. All properties are subject to prior sale, changes, or withdrawal. Copyright 2025 © Cape Cod & Islands Multiple Listing Service, Inc. All rights reserved.