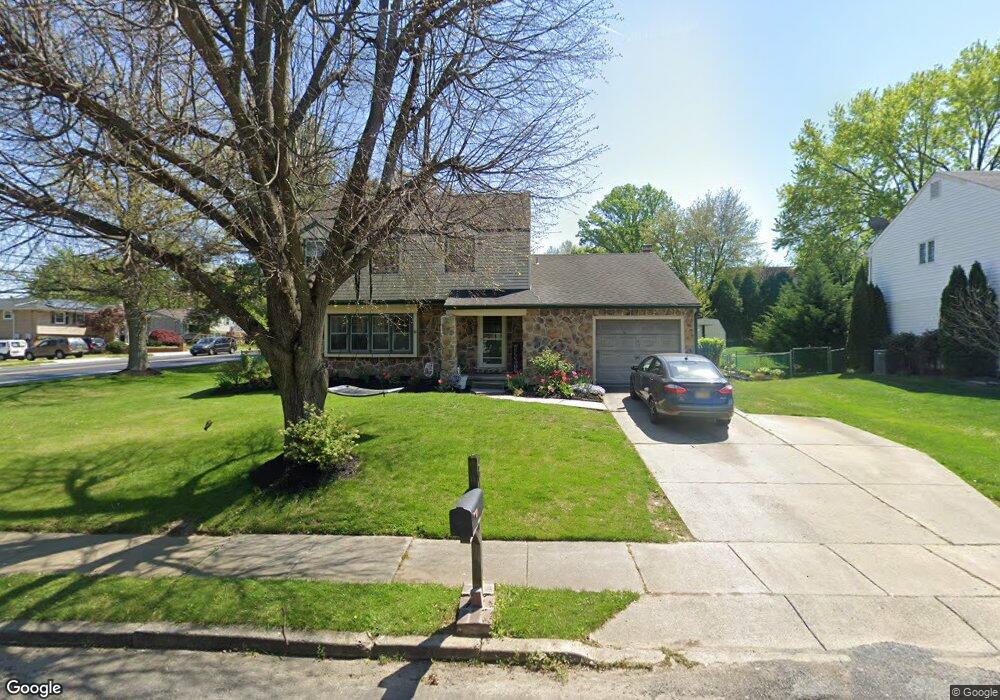
101 Shelly Ln Delran, NJ 08075
Tenby Chase NeighborhoodEstimated Value: $456,000 - $478,039
4
Beds
3
Baths
2,066
Sq Ft
$226/Sq Ft
Est. Value
About This Home
This home is located at 101 Shelly Ln, Delran, NJ 08075 and is currently estimated at $467,510, approximately $226 per square foot. 101 Shelly Ln is a home located in Burlington County with nearby schools including Millbridge Elementary School, Delran Intermediate School, and Delran Middle School.
Ownership History
Date
Name
Owned For
Owner Type
Purchase Details
Closed on
Sep 26, 2011
Sold by
Wells Fargo Bank N A
Bought by
Paiva Marcelo A
Current Estimated Value
Home Financials for this Owner
Home Financials are based on the most recent Mortgage that was taken out on this home.
Original Mortgage
$171,700
Outstanding Balance
$117,950
Interest Rate
4.25%
Mortgage Type
FHA
Estimated Equity
$349,560
Purchase Details
Closed on
Mar 21, 2011
Sold by
Lawlor Robert S and Lawlor Barbara L
Bought by
Wells Fargo Bank N A
Purchase Details
Closed on
Dec 14, 1999
Sold by
Najera Jesus and Najera Patricia
Bought by
Lawlor Robert S and Lawlor Barbara L
Home Financials for this Owner
Home Financials are based on the most recent Mortgage that was taken out on this home.
Original Mortgage
$148,200
Interest Rate
7.91%
Purchase Details
Closed on
Aug 9, 1999
Sold by
Dillenbeck John B and Hendry William
Bought by
Najera Patricia and Najera Jesus
Purchase Details
Closed on
Nov 28, 1995
Sold by
Najera Jesus and Najera Patricia
Bought by
Dillenbeck John B and Hendry William
Create a Home Valuation Report for This Property
The Home Valuation Report is an in-depth analysis detailing your home's value as well as a comparison with similar homes in the area
Home Values in the Area
Average Home Value in this Area
Purchase History
| Date | Buyer | Sale Price | Title Company |
|---|---|---|---|
| Paiva Marcelo A | $180,000 | Servicelink | |
| Wells Fargo Bank N A | -- | None Available | |
| Lawlor Robert S | $156,000 | -- | |
| Najera Patricia | -- | -- | |
| Dillenbeck John B | $155,000 | Medford Title Agency Inc |
Source: Public Records
Mortgage History
| Date | Status | Borrower | Loan Amount |
|---|---|---|---|
| Open | Paiva Marcelo A | $171,700 | |
| Previous Owner | Lawlor Robert S | $148,200 |
Source: Public Records
Tax History Compared to Growth
Tax History
| Year | Tax Paid | Tax Assessment Tax Assessment Total Assessment is a certain percentage of the fair market value that is determined by local assessors to be the total taxable value of land and additions on the property. | Land | Improvement |
|---|---|---|---|---|
| 2025 | $9,057 | $227,800 | $58,500 | $169,300 |
| 2024 | $8,975 | $227,800 | $58,500 | $169,300 |
| 2023 | $8,975 | $227,800 | $58,500 | $169,300 |
| 2022 | $8,859 | $227,800 | $58,500 | $169,300 |
| 2021 | $8,864 | $227,800 | $58,500 | $169,300 |
| 2020 | $8,845 | $227,800 | $58,500 | $169,300 |
| 2019 | $8,763 | $227,800 | $58,500 | $169,300 |
| 2018 | $8,618 | $227,800 | $58,500 | $169,300 |
| 2017 | $8,481 | $227,800 | $58,500 | $169,300 |
| 2016 | $8,356 | $227,800 | $58,500 | $169,300 |
| 2015 | $8,217 | $227,800 | $58,500 | $169,300 |
| 2014 | $7,859 | $227,800 | $58,500 | $169,300 |
Source: Public Records
Map
Nearby Homes
- 60 Notre Dame Dr
- 31 Cornell Dr
- 53 Princeton Dr
- 128 Dorado Dr
- 29 Haines Mill Rd
- 110 Kathleen Ave
- 139 Patricia Ave
- 164 Fox Chase Dr
- 228 Aqua Ln
- 4327 Bridgeboro Rd
- 142 Fox Chase Dr
- 415 Bridgeboro Rd
- 0 0 Swarthmore Dr
- 53 Hartford Rd
- 347 Tom Brown Rd
- 343 Tom Brown Rd
- 2204 New Albany Rd
- 2408 New Albany Rd
- 103 Congressional Ct
- 2209 New Albany Rd
- 103 Shelly Ln
- 113 Timothy Ct
- 115 Timothy Ct
- 98 Haines Mill Rd
- 105 Shelly Ln
- 100 Shelly Ln
- 96 Haines Mill Rd
- 102 Shelly Ln
- 100 Haines Mill Rd
- 94 Haines Mill Rd
- 111 Timothy Ct
- 104 Shelly Ln
- 102 Haines Mill Rd
- 92 Haines Mill Rd
- 107 Shelly Ln
- 12 Lehigh Dr
- 101 Greenbriar Rd
- 14 Lehigh Dr
- 106 Shelly Ln
- 10 Lehigh Dr