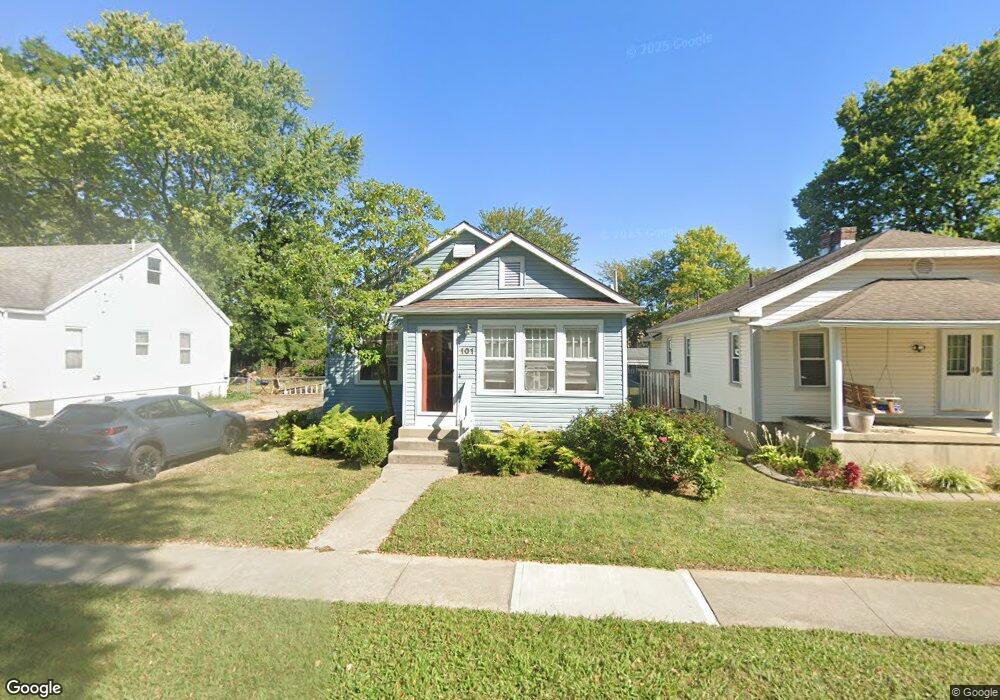
101 Tate Ave Englewood, OH 45322
Estimated Value: $146,000 - $198,000
3
Beds
1
Bath
1,417
Sq Ft
$124/Sq Ft
Est. Value
About This Home
This home is located at 101 Tate Ave, Englewood, OH 45322 and is currently estimated at $175,948, approximately $124 per square foot. 101 Tate Ave is a home located in Montgomery County with nearby schools including Northmont High School, Trotwood Preparatory & Fitness Academy, and Imagine Schools - Woodbury Academy.
Ownership History
Date
Name
Owned For
Owner Type
Purchase Details
Closed on
Feb 29, 2008
Sold by
Retberg Julie C
Bought by
Blackwell Tina
Current Estimated Value
Home Financials for this Owner
Home Financials are based on the most recent Mortgage that was taken out on this home.
Original Mortgage
$95,993
Outstanding Balance
$59,834
Interest Rate
5.75%
Mortgage Type
Purchase Money Mortgage
Estimated Equity
$116,114
Purchase Details
Closed on
Dec 16, 2004
Sold by
Lucente Billie L and Lucente Phillip
Bought by
Retberg Julie C
Home Financials for this Owner
Home Financials are based on the most recent Mortgage that was taken out on this home.
Original Mortgage
$91,464
Interest Rate
5.82%
Mortgage Type
FHA
Purchase Details
Closed on
Aug 13, 1999
Sold by
Pierron Peter L and Pierron Shelley J
Bought by
Barton Billie Lee
Home Financials for this Owner
Home Financials are based on the most recent Mortgage that was taken out on this home.
Original Mortgage
$79,908
Interest Rate
7.77%
Mortgage Type
FHA
Create a Home Valuation Report for This Property
The Home Valuation Report is an in-depth analysis detailing your home's value as well as a comparison with similar homes in the area
Home Values in the Area
Average Home Value in this Area
Purchase History
| Date | Buyer | Sale Price | Title Company |
|---|---|---|---|
| Blackwell Tina | $97,500 | Attorney | |
| Retberg Julie C | $92,900 | None Available | |
| Barton Billie Lee | $82,000 | -- |
Source: Public Records
Mortgage History
| Date | Status | Borrower | Loan Amount |
|---|---|---|---|
| Open | Blackwell Tina | $95,993 | |
| Previous Owner | Retberg Julie C | $91,464 | |
| Previous Owner | Barton Billie Lee | $79,908 |
Source: Public Records
Tax History Compared to Growth
Tax History
| Year | Tax Paid | Tax Assessment Tax Assessment Total Assessment is a certain percentage of the fair market value that is determined by local assessors to be the total taxable value of land and additions on the property. | Land | Improvement |
|---|---|---|---|---|
| 2024 | $2,198 | $38,390 | $7,630 | $30,760 |
| 2023 | $2,198 | $38,390 | $7,630 | $30,760 |
| 2022 | $2,131 | $28,650 | $5,700 | $22,950 |
| 2021 | $2,137 | $28,650 | $5,700 | $22,950 |
| 2020 | $2,099 | $28,650 | $5,700 | $22,950 |
| 2019 | $2,054 | $25,150 | $5,430 | $19,720 |
| 2018 | $2,017 | $25,150 | $5,430 | $19,720 |
| 2017 | $2,003 | $25,150 | $5,430 | $19,720 |
| 2016 | $1,962 | $24,210 | $5,430 | $18,780 |
| 2015 | $1,795 | $24,210 | $5,430 | $18,780 |
| 2014 | $1,795 | $24,210 | $5,430 | $18,780 |
| 2012 | -- | $28,900 | $5,430 | $23,470 |
Source: Public Records
Map
Nearby Homes
- 108 Tate Ave
- 607 Albert St
- 109 Silverstone Dr
- 104 Silverstone Dr
- 123 Chestnut St
- 206 Lodestone Dr
- 803 Albert St
- 800 Sipos Cir
- 118 Elm Ct
- 510 Rohr Ln
- 534 Unger Ave
- 320 Camborne Dr
- 717 Woodlawn Ave
- 718 Bonnycastle Ave
- 332 Beckenham Rd
- 510 Lambert Ln
- 408 W Herr St
- 108 Denwood Trail
- 322 Rankin Dr
- 321 Rankin Dr