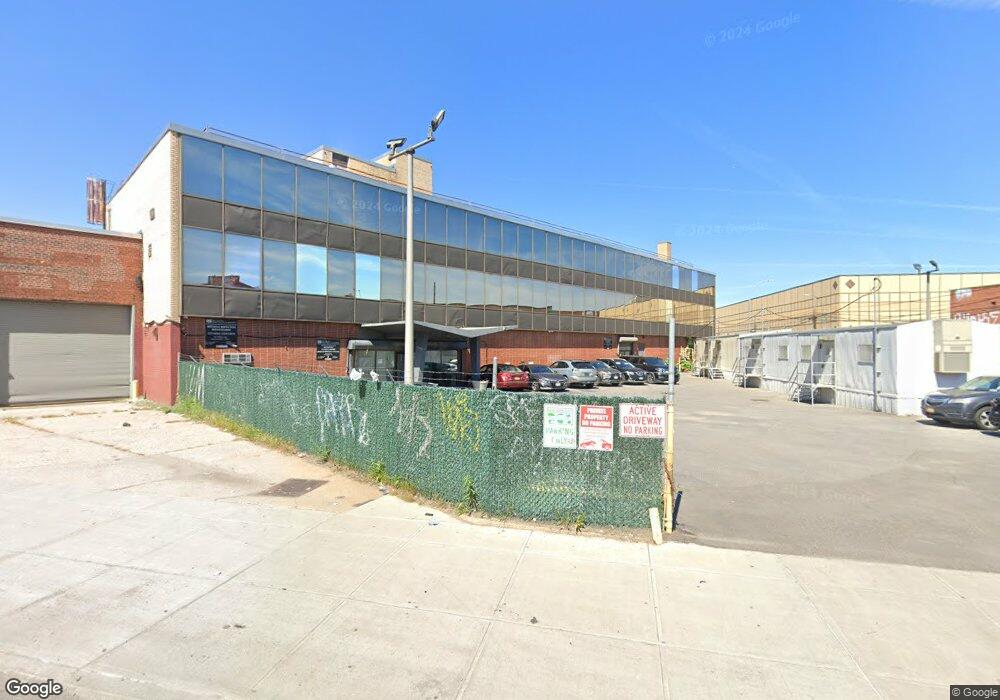
101 Varick Ave Brooklyn, NY 11237
East Williamsburg NeighborhoodEstimated Value: $57,934,250
Studio
--
Bath
130,900
Sq Ft
$443/Sq Ft
Est. Value
About This Home
This home is located at 101 Varick Ave, Brooklyn, NY 11237 and is currently estimated at $57,934,250, approximately $442 per square foot. 101 Varick Ave is a home located in Kings County with nearby schools including MS 582 The Magnet School for Multimedia, Technology, and Urban Planning and Williamsburg Charter High School.
Ownership History
Date
Name
Owned For
Owner Type
Purchase Details
Closed on
Jul 21, 2016
Sold by
Adar Holding Realty Llc
Bought by
101 Varick Ii Llc
Current Estimated Value
Home Financials for this Owner
Home Financials are based on the most recent Mortgage that was taken out on this home.
Original Mortgage
$16,774,948
Outstanding Balance
$13,301,572
Interest Rate
3.54%
Mortgage Type
Commercial
Estimated Equity
$44,632,678
Purchase Details
Closed on
Nov 14, 2012
Sold by
Waste Management Of New York Llc and % Real Estate Dept 720 East Butterfie
Bought by
Adar Holding Realty Llc
Home Financials for this Owner
Home Financials are based on the most recent Mortgage that was taken out on this home.
Original Mortgage
$5,250,000
Interest Rate
3.4%
Mortgage Type
Commercial
Purchase Details
Closed on
Mar 22, 1996
Sold by
New York City Industrial Development Age
Bought by
Feldman Robert A
Purchase Details
Closed on
Mar 20, 1996
Sold by
Feldman Robert A
Bought by
New York Acquisition Sub Inc
Create a Home Valuation Report for This Property
The Home Valuation Report is an in-depth analysis detailing your home's value as well as a comparison with similar homes in the area
Home Values in the Area
Average Home Value in this Area
Purchase History
| Date | Buyer | Sale Price | Title Company |
|---|---|---|---|
| 101 Varick Ii Llc | $43,250,000 | -- | |
| 101 Varick Ii Llc | $43,250,000 | -- | |
| Adar Holding Realty Llc | $10,500,000 | -- | |
| Adar Holding Realty Llc | $10,500,000 | -- | |
| Feldman Robert A | -- | -- | |
| Feldman Robert A | -- | -- | |
| New York Acquisition Sub Inc | $4,200,000 | Chicago Title Insurance Co | |
| New York Acquisition Sub Inc | $4,200,000 | Chicago Title Insurance Co |
Source: Public Records
Mortgage History
| Date | Status | Borrower | Loan Amount |
|---|---|---|---|
| Open | 101 Varick Ii Llc | $16,774,948 | |
| Closed | 101 Varick Ii Llc | $16,774,948 | |
| Previous Owner | Adar Holding Realty Llc | $5,250,000 | |
| Closed | Adar Holding Realty Llc | $8,515,000 |
Source: Public Records
Tax History
| Year | Tax Paid | Tax Assessment Tax Assessment Total Assessment is a certain percentage of the fair market value that is determined by local assessors to be the total taxable value of land and additions on the property. | Land | Improvement |
|---|---|---|---|---|
| 2025 | $690,489 | $7,816,050 | $1,883,700 | $5,932,350 |
| 2024 | $690,489 | $7,650,450 | $1,883,700 | $5,766,750 |
| 2023 | $655,100 | $6,707,700 | $1,883,700 | $4,824,000 |
| 2022 | $632,071 | $6,128,100 | $1,883,700 | $4,244,400 |
| 2021 | $600,501 | $6,054,300 | $1,883,700 | $4,170,600 |
| 2020 | $267,927 | $5,647,950 | $1,883,700 | $3,764,250 |
| 2019 | $481,287 | $5,415,300 | $1,883,700 | $3,531,600 |
| 2018 | $443,843 | $4,942,350 | $1,883,700 | $3,058,650 |
| 2017 | $416,260 | $4,380,750 | $1,436,850 | $2,943,900 |
| 2016 | $406,521 | $4,305,150 | $1,436,850 | $2,868,300 |
| 2015 | $177,467 | $3,848,400 | $1,436,850 | $2,411,550 |
| 2014 | $177,467 | $3,630,600 | $1,436,850 | $2,193,750 |
Source: Public Records
Map
Nearby Homes
- 1048 Flushing Ave Unit 4L
- 21 Thames St
- 299 Troutman St
- 1196 Metropolitan Ave Unit 2 A
- 151 Noll St
- 58 Saint Nicholas Ave
- 409 Suydam St Unit 6
- 18-60 Flushing Ave
- 905 Hart St
- 296 Suydam St
- 17-07 Suydam St
- 474 Suydam St
- 994 Hart St
- 236 Suydam St
- 21 Charlotte St
- 1073 Willoughby Ave Unit 3B
- 1073 Willoughby Ave Unit 2A
- 1073 Willoughby Ave Unit 4B
- 1073 Willoughby Ave Unit 2B
- 1073 Willoughby Ave Unit 1A
- 469 Johnson Ave
- 498 Johnson Ave
- 89-111 Porter Ave
- 512 Johnson Ave
- 72 Varick Ave
- 465 Johnson Ave
- 526 Johnson Ave
- 103-115 Varick Ave
- 90-100 Varick Ave
- 474 Johnson Ave
- 152 Randolph St
- 119 Ingraham St
- 134 Ingraham St
- 108 Varick Ave
- 91 Ingraham St
- 47 Varick Ave
- 536 Johnson Ave
- 110-120 Ingraham St
- 65-87 Porter Ave
- 450 Johnson Ave
Your Personal Tour Guide
Ask me questions while you tour the home.