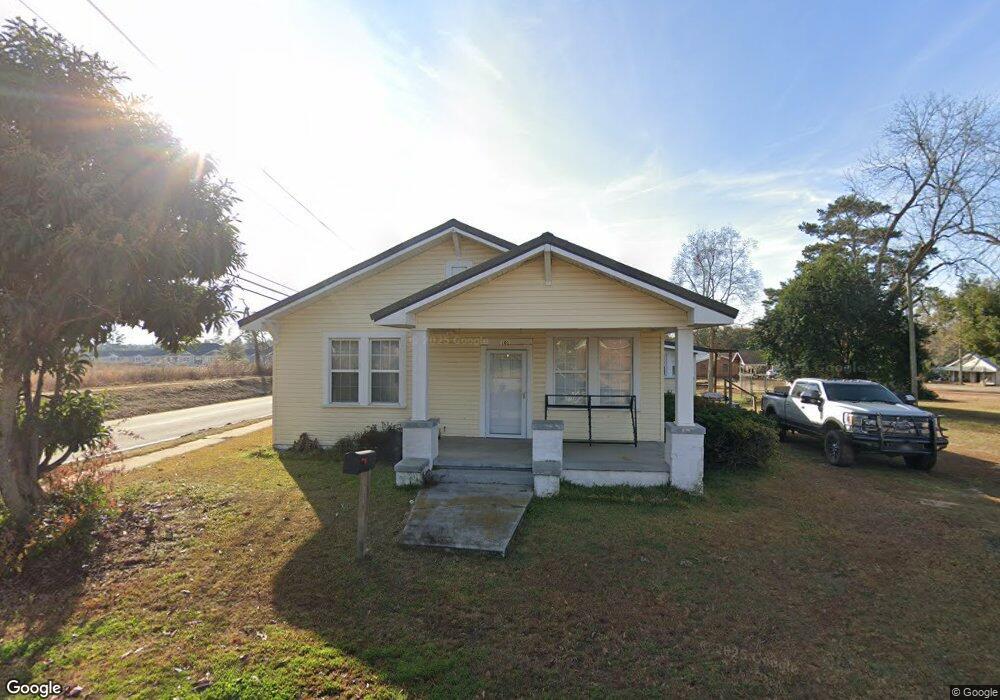
101 W Carr St Colquitt, GA 39837
Estimated Value: $116,067 - $131,000
3
Beds
1
Bath
1,291
Sq Ft
$95/Sq Ft
Est. Value
About This Home
This home is located at 101 W Carr St, Colquitt, GA 39837 and is currently estimated at $123,017, approximately $95 per square foot. 101 W Carr St is a home located in Miller County with nearby schools including Miller County Elementary School, Miller County Middle School, and Miller County High School.
Ownership History
Date
Name
Owned For
Owner Type
Purchase Details
Closed on
Apr 20, 2021
Sold by
Grimsley Properties Llc
Bought by
Lane Robert A
Current Estimated Value
Purchase Details
Closed on
Aug 2, 2011
Sold by
Grimsley Properties Llc
Bought by
Grimsley Properties Llc
Purchase Details
Closed on
Apr 1, 2010
Sold by
Grimsley Properties Llc
Bought by
Muller James
Home Financials for this Owner
Home Financials are based on the most recent Mortgage that was taken out on this home.
Original Mortgage
$64,768
Interest Rate
4.91%
Mortgage Type
Purchase Money Mortgage
Purchase Details
Closed on
Dec 31, 2009
Sold by
Union Investment Company Inc
Bought by
Grimsley Properties Llc
Home Financials for this Owner
Home Financials are based on the most recent Mortgage that was taken out on this home.
Original Mortgage
$353,500
Interest Rate
4.82%
Mortgage Type
Purchase Money Mortgage
Purchase Details
Closed on
May 21, 2003
Sold by
Rebecca B Dozier
Bought by
Union Investment Co Inc
Create a Home Valuation Report for This Property
The Home Valuation Report is an in-depth analysis detailing your home's value as well as a comparison with similar homes in the area
Home Values in the Area
Average Home Value in this Area
Purchase History
| Date | Buyer | Sale Price | Title Company |
|---|---|---|---|
| Lane Robert A | $82,900 | -- | |
| Grimsley Properties Llc | -- | -- | |
| Muller James | $70,400 | -- | |
| Grimsley Properties Llc | $338,500 | -- | |
| Union Investment Co Inc | $20,000 | -- |
Source: Public Records
Mortgage History
| Date | Status | Borrower | Loan Amount |
|---|---|---|---|
| Previous Owner | Muller James | $64,768 | |
| Previous Owner | Grimsley Properties Llc | $353,500 |
Source: Public Records
Tax History Compared to Growth
Tax History
| Year | Tax Paid | Tax Assessment Tax Assessment Total Assessment is a certain percentage of the fair market value that is determined by local assessors to be the total taxable value of land and additions on the property. | Land | Improvement |
|---|---|---|---|---|
| 2024 | $1,783 | $41,892 | $1,531 | $40,361 |
| 2023 | $1,131 | $25,377 | $1,531 | $23,846 |
| 2022 | $744 | $19,437 | $1,531 | $17,906 |
| 2021 | $736 | $19,437 | $1,531 | $17,906 |
| 2020 | $736 | $19,437 | $1,531 | $17,906 |
| 2019 | $738 | $19,437 | $1,531 | $17,906 |
| 2018 | $909 | $19,437 | $1,531 | $17,906 |
| 2017 | $909 | $19,437 | $1,531 | $17,906 |
| 2016 | $717 | $19,436 | $1,531 | $17,906 |
| 2015 | -- | $19,750 | $1,590 | $18,161 |
| 2014 | -- | $19,750 | $1,590 | $18,161 |
| 2013 | -- | $19,750 | $1,589 | $18,160 |
Source: Public Records
Map
Nearby Homes
- 102 Bremond St
- US 27 Us Highway 27
- 2835 Georgia 91
- 356 E Main St
- 157 E Pine St
- 210 N First St
- 570 E Pine St
- 300 N First St
- 708 E Crawford St
- 000 Thompson Town Rd
- 721 E Crawford St
- 000 Phillipsburg Rd
- 000 Bellview Rd
- 1203 Bellview Rd
- 113 Crooked Oak Ln
- 1502 Brinson Rd
- 745 Harmony Church Rd
- 1545 Phillipsburg Rd
- 1563 Ga Highway 27 N
- 430 Cox Rd