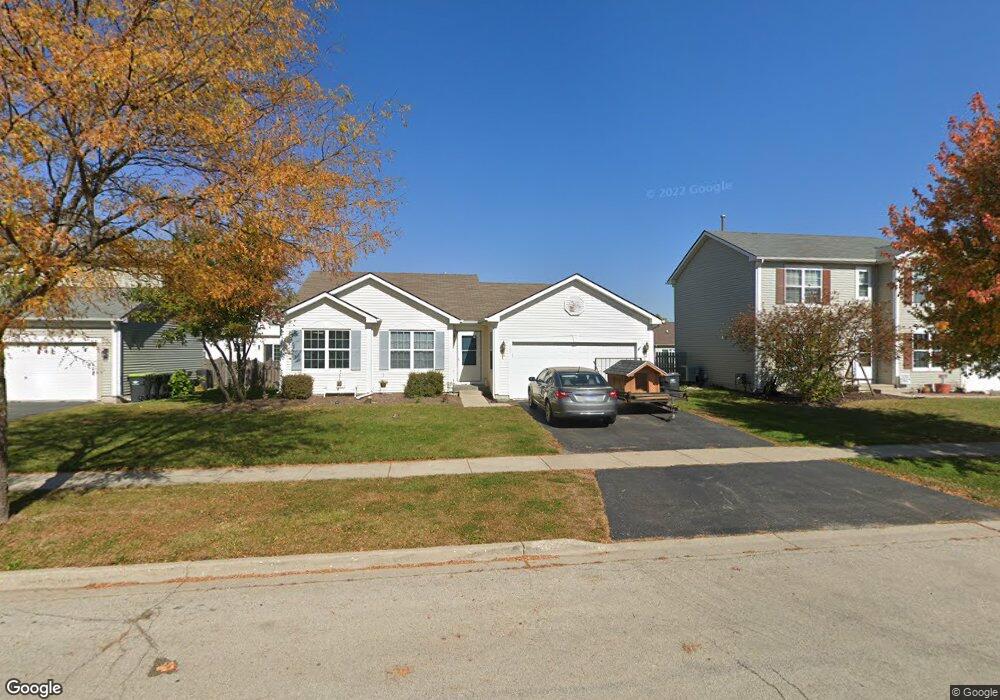
101 W Crabapple Ave Cortland, IL 60112
Estimated Value: $279,760 - $318,000
3
Beds
2
Baths
1,350
Sq Ft
$222/Sq Ft
Est. Value
About This Home
This home is located at 101 W Crabapple Ave, Cortland, IL 60112 and is currently estimated at $299,690, approximately $221 per square foot. 101 W Crabapple Ave is a home located in DeKalb County with nearby schools including Sycamore High School and St Mary's Catholic School.
Ownership History
Date
Name
Owned For
Owner Type
Purchase Details
Closed on
Mar 9, 2012
Sold by
Federal National Mortgage Association
Bought by
Miller Jason S
Current Estimated Value
Home Financials for this Owner
Home Financials are based on the most recent Mortgage that was taken out on this home.
Original Mortgage
$114,520
Outstanding Balance
$78,215
Interest Rate
3.75%
Mortgage Type
FHA
Estimated Equity
$221,475
Purchase Details
Closed on
Aug 26, 2011
Sold by
Dekalb County Sheriff
Bought by
Federal National Mortgage Association
Purchase Details
Closed on
May 23, 2007
Sold by
Eagle Homes Natures Crossing
Bought by
Egler Kyle J and Egler Trisha M
Home Financials for this Owner
Home Financials are based on the most recent Mortgage that was taken out on this home.
Original Mortgage
$166,010
Interest Rate
6.22%
Mortgage Type
New Conventional
Create a Home Valuation Report for This Property
The Home Valuation Report is an in-depth analysis detailing your home's value as well as a comparison with similar homes in the area
Home Values in the Area
Average Home Value in this Area
Purchase History
| Date | Buyer | Sale Price | Title Company |
|---|---|---|---|
| Miller Jason S | $117,500 | -- | |
| Federal National Mortgage Association | -- | -- | |
| Egler Kyle J | $208,000 | -- |
Source: Public Records
Mortgage History
| Date | Status | Borrower | Loan Amount |
|---|---|---|---|
| Open | Miller Jason S | $114,520 | |
| Previous Owner | Egler Kyle J | $166,010 |
Source: Public Records
Tax History Compared to Growth
Tax History
| Year | Tax Paid | Tax Assessment Tax Assessment Total Assessment is a certain percentage of the fair market value that is determined by local assessors to be the total taxable value of land and additions on the property. | Land | Improvement |
|---|---|---|---|---|
| 2024 | $4,742 | $60,376 | $16,315 | $44,061 |
| 2023 | $4,742 | $56,484 | $15,263 | $41,221 |
| 2022 | $4,678 | $53,908 | $14,567 | $39,341 |
| 2021 | $4,395 | $50,919 | $13,869 | $37,050 |
| 2020 | $4,302 | $49,330 | $13,436 | $35,894 |
| 2019 | $4,123 | $47,260 | $12,872 | $34,388 |
| 2018 | $3,944 | $44,694 | $12,173 | $32,521 |
| 2017 | $3,807 | $42,550 | $11,589 | $30,961 |
| 2016 | $3,658 | $39,991 | $10,892 | $29,099 |
| 2015 | $4,853 | $47,176 | $10,228 | $36,948 |
| 2014 | $4,853 | $45,405 | $9,844 | $35,561 |
| 2013 | $4,853 | $47,912 | $10,201 | $37,711 |
Source: Public Records
Map
Nearby Homes
- LOT E7 W Bluebell Ave
- Lot D7 Bluebell
- Lot C7 Crabapple Ave
- 94 Crabapple Ave
- 94 W Crabapple Ave
- 20 W Sandalwood Ave
- 20 Sandalwood Ave
- 37 W Sandalwood Ave
- Lot 2 Stonegate
- 42 W Auburndale Ave
- 437 N Charles St Unit 7
- 353 N Aspen Dr
- 347 N Aspen Dr
- 341 N Aspen Dr
- 335 N Aspen Dr
- 329 N Aspen Dr
- 300 N Aspen Dr
- 86 E Daisy Ave
- 189 E Lark Ave
- 95 Lots Chestnut Grove
- 93 W Crabapple Ave
- 109 W Crabapple Ave
- Lot B13 Crabapple Ave
- Lot B12 Crabapple Ave
- Lot B10 Crabapple Ave
- Lot B11 Crabapple Ave
- Lot C2 Crabapple Ave
- Lot c3 W Crabapple Ave
- 73 W Crabapple Ave
- 108 W Crabapple Ave
- 68 W Crabapple Ave
- 74 W Crabapple Ave
- 78 W Winterberry Ave
- 61 W Crabapple Ave
- 64 W Winterberry Ave
- 674 N Goldenrod St
- 84 W Winterberry Ave
- 51 W Crabapple Ave
- 50 W Winterberry Ave
- 90 W Winterberry Ave