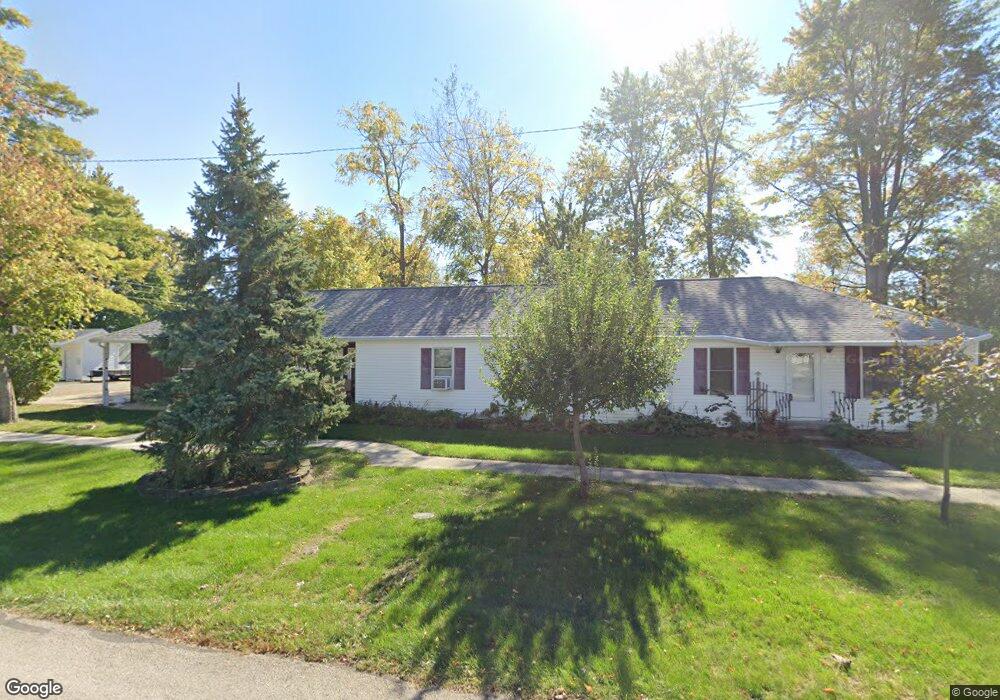
101 W Walnut St Mendon, OH 45862
Estimated Value: $118,000 - $171,000
2
Beds
2
Baths
1,825
Sq Ft
$79/Sq Ft
Est. Value
About This Home
This home is located at 101 W Walnut St, Mendon, OH 45862 and is currently estimated at $144,947, approximately $79 per square foot. 101 W Walnut St is a home located in Mercer County with nearby schools including Parkway Elementary School, Parkway Middle School, and Parkway High School.
Ownership History
Date
Name
Owned For
Owner Type
Purchase Details
Closed on
Oct 14, 2024
Sold by
Hartings Patricia L and Hartings Myron F
Bought by
Diegel Reid and Diegel Deana
Current Estimated Value
Purchase Details
Closed on
Apr 30, 2008
Sold by
Hartings Patty and Hartings Myron F
Bought by
Hartings Patricia L and Hartings Myron F
Purchase Details
Closed on
Mar 26, 2008
Sold by
Diegel Reid and Diegel Deana
Bought by
Hartings Patty and Hartings Patricia
Purchase Details
Closed on
Feb 11, 2008
Sold by
Diegel Christopher
Bought by
Hartings Patty and Hartings Patricia
Purchase Details
Closed on
Jan 28, 2008
Sold by
Oechsle Julie and Oechsle Timothy
Bought by
Hartings Patty and Hartings Patricia
Purchase Details
Closed on
Jan 22, 2008
Sold by
Franklin Hazel and Franklin Michael
Bought by
Hartings Patty and Hartings Patricia
Purchase Details
Closed on
Jan 12, 2008
Sold by
Diegel Ganell P
Bought by
Hartings Patty and Hartings Patricia
Create a Home Valuation Report for This Property
The Home Valuation Report is an in-depth analysis detailing your home's value as well as a comparison with similar homes in the area
Purchase History
| Date | Buyer | Sale Price | Title Company |
|---|---|---|---|
| Diegel Reid | $144,100 | None Listed On Document | |
| Diegel Reid | $144,100 | None Listed On Document | |
| Hartings Patricia L | -- | Attorney | |
| Hartings Patty | -- | Attorney | |
| Hartings Patty | -- | Attorney | |
| Hartings Patty | -- | Attorney | |
| Hartings Patty | -- | Attorney | |
| Hartings Patty | -- | Attorney |
Source: Public Records
Tax History
| Year | Tax Paid | Tax Assessment Tax Assessment Total Assessment is a certain percentage of the fair market value that is determined by local assessors to be the total taxable value of land and additions on the property. | Land | Improvement |
|---|---|---|---|---|
| 2025 | $1,188 | $43,230 | $6,930 | $36,300 |
| 2024 | $1,577 | $43,230 | $6,930 | $36,300 |
| 2023 | $1,188 | $43,230 | $6,930 | $36,300 |
| 2022 | $877 | $28,560 | $5,740 | $22,820 |
| 2021 | $872 | $28,560 | $5,740 | $22,820 |
| 2020 | $445 | $28,560 | $5,740 | $22,820 |
| 2019 | $631 | $23,310 | $4,340 | $18,970 |
| 2018 | $617 | $23,310 | $4,340 | $18,970 |
| 2017 | $590 | $23,310 | $4,340 | $18,970 |
| 2016 | $563 | $22,930 | $4,030 | $18,900 |
| 2015 | $549 | $22,720 | $4,030 | $18,690 |
| 2014 | $536 | $22,550 | $4,030 | $18,520 |
| 2013 | $655 | $24,260 | $4,340 | $19,920 |
Source: Public Records
Map
Nearby Homes
- 0 Drake St
- 205 N Main St
- 8323 Deep Cut Rd
- 12029 Dutton Rd
- 0 Mercer van Wert County Line Rd
- 21183 Ohio 116
- 16885 Jonestown Rd
- 16216 Jonestown Rd
- 311 S Main St
- 205 Market St
- 208 Market St
- 103 Wayne St
- 7957 W Bridge St
- 2100 Golfview Dr
- 2504 Eaglebrooke Pkwy
- 2409 Eaglebrooke Pkwy
- 8041 Oldtown Rd
- 7422 Staeger Rd
- 0 Wilson Unit 1037059
- 0 Wilson Unit 306333
Your Personal Tour Guide
Ask me questions while you tour the home.