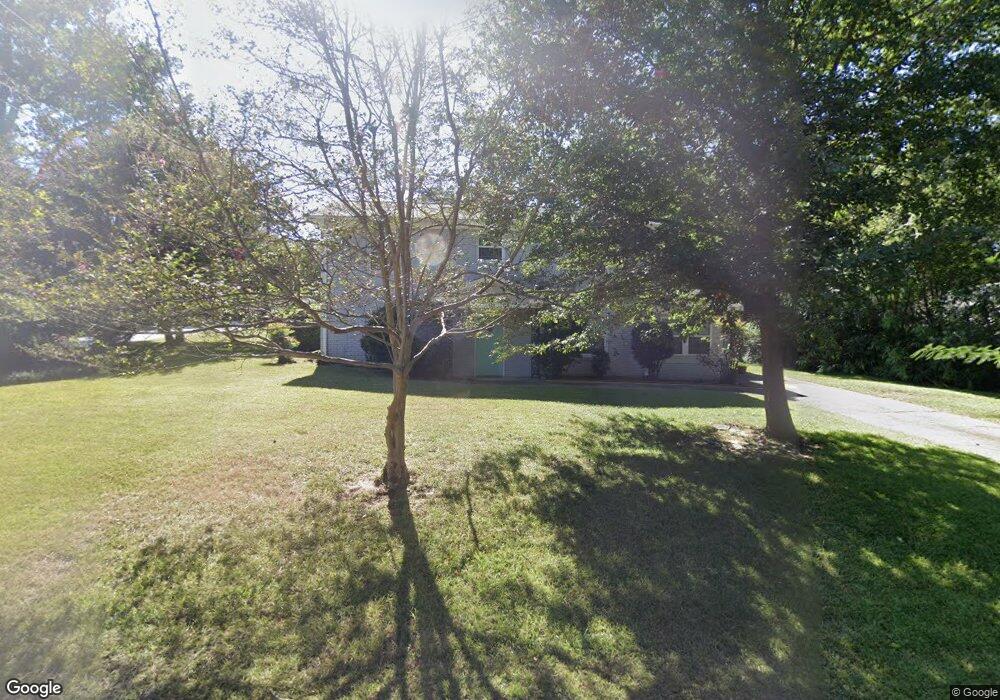
101 Waccamaw Ave Columbia, SC 29205
Wales Garden NeighborhoodEstimated Value: $410,089 - $597,000
1
Bed
1
Bath
800
Sq Ft
$640/Sq Ft
Est. Value
About This Home
This home is located at 101 Waccamaw Ave, Columbia, SC 29205 and is currently estimated at $511,772, approximately $639 per square foot. 101 Waccamaw Ave is a home located in Richland County with nearby schools including A. C. Moore Elementary School, Hand Middle School, and Dreher High School.
Ownership History
Date
Name
Owned For
Owner Type
Purchase Details
Closed on
Jun 30, 2016
Sold by
Flynt Willam Charles and Scott Megan Vaughn
Bought by
Woodley Victoria and Woodley Lance
Current Estimated Value
Home Financials for this Owner
Home Financials are based on the most recent Mortgage that was taken out on this home.
Original Mortgage
$188,441
Outstanding Balance
$151,252
Interest Rate
3.75%
Mortgage Type
FHA
Estimated Equity
$360,520
Purchase Details
Closed on
Nov 30, 2011
Sold by
Austin Trudie Smith and Smith Robert Samuel
Bought by
Flynt William Charles and Scott Megan Vaughn
Home Financials for this Owner
Home Financials are based on the most recent Mortgage that was taken out on this home.
Original Mortgage
$207,875
Interest Rate
4.15%
Mortgage Type
VA
Purchase Details
Closed on
Aug 25, 2011
Sold by
Estate Of John Hemby Smith
Bought by
Austin Trudie Smith and Smiht John Hemby
Purchase Details
Closed on
May 21, 1999
Sold by
Reamer Margaret
Bought by
Smith John Memby
Create a Home Valuation Report for This Property
The Home Valuation Report is an in-depth analysis detailing your home's value as well as a comparison with similar homes in the area
Home Values in the Area
Average Home Value in this Area
Purchase History
| Date | Buyer | Sale Price | Title Company |
|---|---|---|---|
| Woodley Victoria | $231,500 | None Available | |
| Flynt William Charles | $203,500 | -- | |
| Austin Trudie Smith | -- | -- | |
| Smith John Memby | -- | -- | |
| Smith John Memby | -- | -- |
Source: Public Records
Mortgage History
| Date | Status | Borrower | Loan Amount |
|---|---|---|---|
| Open | Woodley Victoria | $188,441 | |
| Previous Owner | Flynt William Charles | $207,875 |
Source: Public Records
Tax History Compared to Growth
Tax History
| Year | Tax Paid | Tax Assessment Tax Assessment Total Assessment is a certain percentage of the fair market value that is determined by local assessors to be the total taxable value of land and additions on the property. | Land | Improvement |
|---|---|---|---|---|
| 2024 | $1,755 | $304,600 | $0 | $0 |
| 2023 | $1,755 | $10,596 | $0 | $0 |
| 2022 | $1,560 | $264,900 | $110,000 | $154,900 |
| 2021 | $1,985 | $10,600 | $0 | $0 |
| 2020 | $2,094 | $10,600 | $0 | $0 |
| 2019 | $2,109 | $10,600 | $0 | $0 |
| 2018 | $1,884 | $9,260 | $0 | $0 |
| 2017 | $1,835 | $9,260 | $0 | $0 |
| 2016 | $6,054 | $8,540 | $0 | $0 |
| 2015 | $2,992 | $8,536 | $0 | $0 |
| 2014 | $2,974 | $213,400 | $0 | $0 |
| 2013 | -- | $8,536 | $0 | $0 |
Source: Public Records
Map
Nearby Homes
- 101 S Waccamaw Ave
- 121 Saluda Ave
- 102 S Gregg St
- 1803 Enoree Ave
- 2408 Wilmot Ave
- 1731 Maplewood Dr
- 2329 Wilmot Ave
- 409 Waccamaw Ave
- 2600 Kiawah Ave
- 107 Southwood Dr
- 2614 Burney Dr
- 2611 Monroe St
- 2009 Wheat St
- 1716 Phelps St
- 1701 Pinewood Dr
- 2218 Rosewood Dr
- 422 Joshua St
- 1804 Wheat St
- 1750 Wheat St
- 2733 Monroe St
- 111 Waccamaw Ave
- 2019 Heyward St
- 134 Waccamaw Ave
- 115 Waccamaw Ave
- 104 S Waccamaw Ave
- 2010 Heyward St
- 108 Waccamaw Ave
- 110 Edisto Ave
- 107 Harden St
- 102 Edisto Ave
- 109 Harden St
- 111 Harden St Unit A
- 121 Waccamaw Ave
- 103 Harden St
- 108 S Waccamaw Ave
- 115 Harden St
- 116 Edisto Ave
- 100 S Edisto Ave
- 101 S Harden St
- 127 Waccamaw Ave Unit A