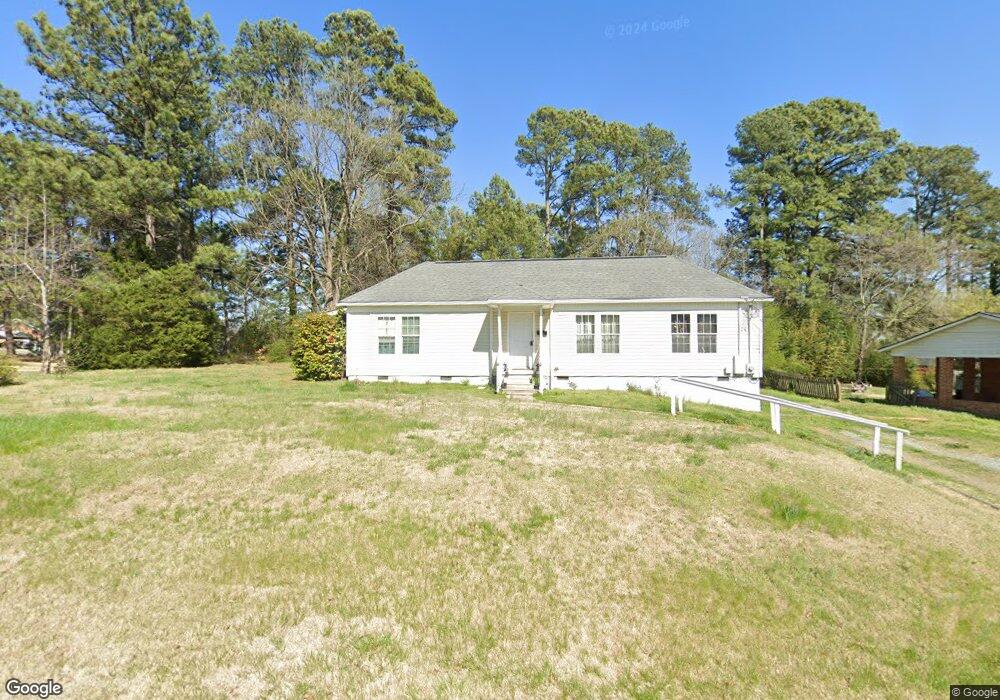
101 White Oak Dr Siler City, NC 27344
Estimated Value: $171,000 - $208,000
3
Beds
2
Baths
1,566
Sq Ft
$120/Sq Ft
Est. Value
About This Home
This home is located at 101 White Oak Dr, Siler City, NC 27344 and is currently estimated at $187,982, approximately $120 per square foot. 101 White Oak Dr is a home located in Chatham County with nearby schools including Virginia Cross Elementary School, Chatham Middle, and Jordan Matthews High.
Ownership History
Date
Name
Owned For
Owner Type
Purchase Details
Closed on
Aug 9, 2016
Sold by
My Property Rehab Llc
Bought by
Burgett Emory W and Burgett Lorna J
Current Estimated Value
Home Financials for this Owner
Home Financials are based on the most recent Mortgage that was taken out on this home.
Original Mortgage
$58,500
Outstanding Balance
$46,955
Interest Rate
3.75%
Mortgage Type
Adjustable Rate Mortgage/ARM
Estimated Equity
$141,027
Purchase Details
Closed on
Jul 10, 2013
Sold by
Neighborhood Housing Group Llc
Bought by
My Property Rehab Llc
Purchase Details
Closed on
Jun 24, 2013
Sold by
Secretary Of Housing & Urban Development
Bought by
Neighborhood Housing Group Llc
Purchase Details
Closed on
Nov 9, 2012
Sold by
Waldon Joyce Campbell
Bought by
Secretary Of Housing & Urban Development
Create a Home Valuation Report for This Property
The Home Valuation Report is an in-depth analysis detailing your home's value as well as a comparison with similar homes in the area
Home Values in the Area
Average Home Value in this Area
Purchase History
| Date | Buyer | Sale Price | Title Company |
|---|---|---|---|
| Burgett Emory W | $70,000 | Attorney | |
| My Property Rehab Llc | $43,000 | None Available | |
| Neighborhood Housing Group Llc | -- | None Available | |
| Secretary Of Housing & Urban Development | $75,200 | None Available |
Source: Public Records
Mortgage History
| Date | Status | Borrower | Loan Amount |
|---|---|---|---|
| Open | Burgett Emory W | $58,500 |
Source: Public Records
Tax History Compared to Growth
Tax History
| Year | Tax Paid | Tax Assessment Tax Assessment Total Assessment is a certain percentage of the fair market value that is determined by local assessors to be the total taxable value of land and additions on the property. | Land | Improvement |
|---|---|---|---|---|
| 2025 | $2,073 | $159,350 | $18,360 | $140,990 |
| 2024 | $2,073 | $108,958 | $17,000 | $91,958 |
| 2023 | $1,378 | $108,958 | $17,000 | $91,958 |
| 2022 | $1,313 | $108,958 | $17,000 | $91,958 |
| 2021 | $1,313 | $108,958 | $17,000 | $91,958 |
| 2020 | $853 | $70,524 | $13,500 | $57,024 |
| 2019 | $853 | $70,524 | $13,500 | $57,024 |
| 2018 | $803 | $70,524 | $13,500 | $57,024 |
| 2017 | $803 | $70,524 | $13,500 | $57,024 |
| 2016 | $937 | $84,120 | $15,000 | $69,120 |
| 2015 | $927 | $84,120 | $15,000 | $69,120 |
| 2014 | $927 | $84,120 | $15,000 | $69,120 |
| 2013 | -- | $84,120 | $15,000 | $69,120 |
Source: Public Records
Map
Nearby Homes
- TBD E 3rd St
- 00 U S Highway 64
- 17880 U S Highway 64
- 1201 Red Sunset Place
- 409 E 10th St
- 726 S 2nd Ave
- 4085 Alston Bridge Rd
- 701 S Chatham Ave
- 303 W Dolphin St
- 519 W Raleigh St
- 513 W Glendale St
- 707 Lakewood Dr
- 0 Loves Creek Church Rd Unit 2396020
- 1707 N Chatham Ave
- 803 Woodland Dr
- Tbd W 3rd St
- 128 Olde Manor Ct
- 806 Cliftwood Dr
- 139 Pondarosa Rd
- TBD Siler City Snow Camp Rd
- 103 White Oak Dr
- 804 E Raleigh St
- 103 Central Ave
- 803 E Raleigh St
- 730 E Raleigh St
- 102 White Oak Dr
- 801 E Raleigh St
- 107 Central Ave
- 713 Red Oak Dr
- 808 E Raleigh St
- 726 E Raleigh St
- 0 Red Oak Ave Unit 1664359
- 0 Red Oak Ave Unit 20212223
- 104 White Oak Dr
- 107 White Oak Dr
- 111 Central Ave
- 804 Sheffield Dr
- 802 Sheffield Dr
- 711 Red Oak Dr
- 106 White Oak Dr