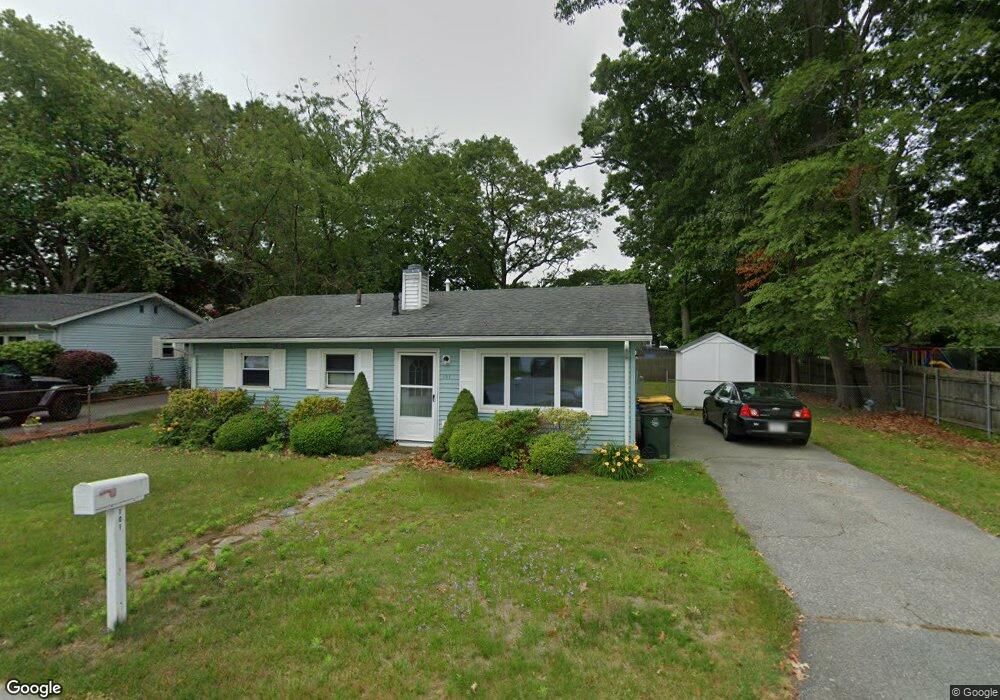
101 Windsor St Fall River, MA 02723
Bank Street NeighborhoodEstimated Value: $363,000 - $454,000
3
Beds
1
Bath
900
Sq Ft
$433/Sq Ft
Est. Value
About This Home
This home is located at 101 Windsor St, Fall River, MA 02723 and is currently estimated at $389,366, approximately $432 per square foot. 101 Windsor St is a home located in Bristol County with nearby schools including Mary Fonseca Elementary School, Talbot Innovation School, and B M C Durfee High School.
Ownership History
Date
Name
Owned For
Owner Type
Purchase Details
Closed on
Aug 12, 2011
Sold by
Riley Jeffrey C
Bought by
Black Joan W
Current Estimated Value
Home Financials for this Owner
Home Financials are based on the most recent Mortgage that was taken out on this home.
Original Mortgage
$115,000
Outstanding Balance
$79,402
Interest Rate
4.51%
Mortgage Type
Purchase Money Mortgage
Estimated Equity
$309,964
Purchase Details
Closed on
May 13, 2011
Sold by
Fnma
Bought by
Riley Jeffrey C
Purchase Details
Closed on
Apr 19, 2011
Sold by
Bac Home Loans Svcng L
Bought by
Federal National Mortgage Association
Purchase Details
Closed on
Feb 6, 2002
Sold by
Ouellette Maria C and Ouellette Raymond C
Bought by
Burroughs Dawn
Create a Home Valuation Report for This Property
The Home Valuation Report is an in-depth analysis detailing your home's value as well as a comparison with similar homes in the area
Home Values in the Area
Average Home Value in this Area
Purchase History
| Date | Buyer | Sale Price | Title Company |
|---|---|---|---|
| Black Joan W | $145,000 | -- | |
| Riley Jeffrey C | $80,000 | -- | |
| Federal National Mortgage Association | $187,061 | -- | |
| Burroughs Dawn | $139,000 | -- |
Source: Public Records
Mortgage History
| Date | Status | Borrower | Loan Amount |
|---|---|---|---|
| Open | Black Joan W | $115,000 | |
| Previous Owner | Burroughs Dawn | $48,800 | |
| Previous Owner | Burroughs Dawn | $160,000 |
Source: Public Records
Tax History
| Year | Tax Paid | Tax Assessment Tax Assessment Total Assessment is a certain percentage of the fair market value that is determined by local assessors to be the total taxable value of land and additions on the property. | Land | Improvement |
|---|---|---|---|---|
| 2025 | $3,206 | $280,000 | $136,300 | $143,700 |
| 2024 | $3,020 | $262,800 | $131,100 | $131,700 |
| 2023 | $2,904 | $236,700 | $117,700 | $119,000 |
| 2022 | $2,586 | $204,900 | $109,000 | $95,900 |
| 2021 | $2,621 | $189,500 | $102,900 | $86,600 |
| 2020 | $2,550 | $176,500 | $99,100 | $77,400 |
| 2019 | $2,495 | $171,100 | $99,100 | $72,000 |
| 2018 | $2,421 | $165,600 | $99,100 | $66,500 |
| 2017 | $2,302 | $164,400 | $99,100 | $65,300 |
| 2016 | $2,193 | $160,900 | $99,100 | $61,800 |
| 2015 | $2,020 | $154,400 | $92,600 | $61,800 |
| 2014 | $1,942 | $154,400 | $92,600 | $61,800 |
Source: Public Records
Map
Nearby Homes
Your Personal Tour Guide
Ask me questions while you tour the home.