
Landlord's Agent in 2024
Sarah Abderrazzaq
Realty ONE Group Old Towne
(540) 273-2777
41 in this area
119 Total Sales

Estimated Value: $570,000 - $638,000
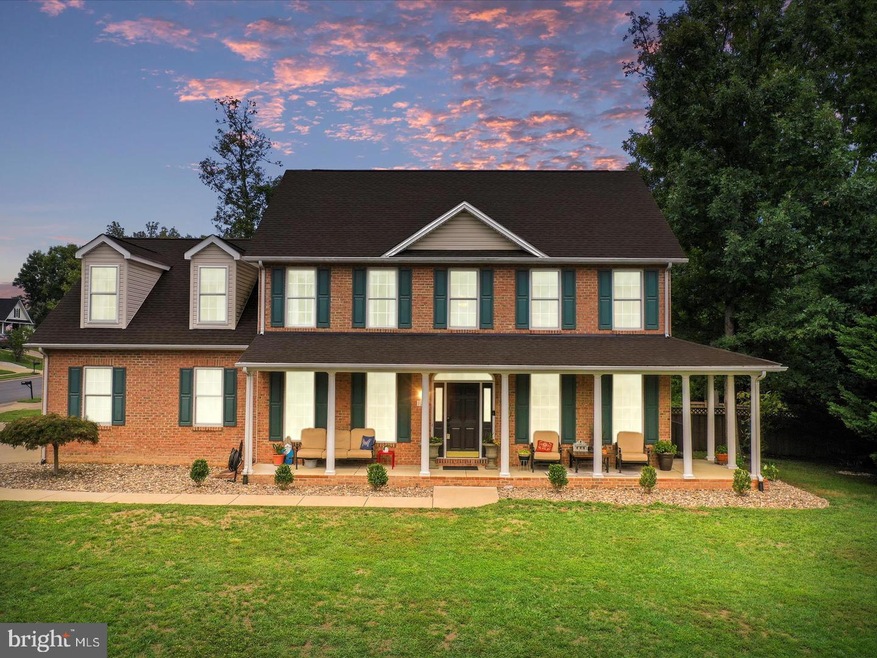
Great colonial with 4 bedrooms and 2.5 baths. Deck, front porch, and nice updates throughout.
Last Agent to Rent the Property
(540) 773-8475 admin@realtyonegroupoldtowne.com Realty ONE Group Old Towne Listed on: 12/05/2024
Last Renter's Agent
(540) 662-3484 kimberly.a.schroeder9@gmail.com Long & Foster Real Estate, Inc. License #WVS230302964
| Date | Buyer | Sale Price | Title Company |
|---|---|---|---|
| Refo Hall Living Trust | -- | None Listed On Document | |
| Hall Timothy A | $585,000 | Clear Title | |
| Beach Jacob Dwaine | $550,000 | Stewart Title |
| Date | Status | Borrower | Loan Amount |
|---|---|---|---|
| Previous Owner | Hall Timothy A | $468,000 | |
| Previous Owner | Beach Jacob Dwaine | $550,000 |
| Date | Event | Price | List to Sale | Price per Sq Ft | Prior Sale |
|---|---|---|---|---|---|
| 12/05/2024 12/05/24 | Rented | $3,150 | 0.0% | -- | |
| 12/05/2024 12/05/24 | For Rent | $3,150 | -99.5% | -- | |
| 12/04/2024 12/04/24 | Under Contract | -- | -- | -- | |
| 11/15/2024 11/15/24 | Sold | $585,000 | -2.5% | $201 / Sq Ft | View Prior Sale |
| 08/30/2024 08/30/24 | For Sale | $600,000 | +9.1% | $206 / Sq Ft | |
| 12/05/2022 12/05/22 | Sold | $550,000 | +0.7% | $189 / Sq Ft | View Prior Sale |
| 11/11/2022 11/11/22 | For Sale | $546,000 | -- | $188 / Sq Ft |
| Year | Tax Paid | Tax Assessment Tax Assessment Total Assessment is a certain percentage of the fair market value that is determined by local assessors to be the total taxable value of land and additions on the property. | Land | Improvement |
|---|---|---|---|---|
| 2025 | $2,657 | $553,600 | $108,000 | $445,600 |
| 2024 | $1,336 | $524,000 | $92,000 | $432,000 |
| 2023 | $2,672 | $524,000 | $92,000 | $432,000 |
| 2022 | $2,429 | $398,200 | $87,000 | $311,200 |
| 2021 | $2,429 | $398,200 | $87,000 | $311,200 |
| 2020 | $2,267 | $371,600 | $87,000 | $284,600 |
| 2019 | $2,267 | $371,600 | $87,000 | $284,600 |
| 2018 | $2,145 | $351,700 | $87,000 | $264,700 |
| 2017 | $2,110 | $351,700 | $87,000 | $264,700 |
| 2016 | $2,107 | $351,200 | $74,500 | $276,700 |
| 2015 | $1,967 | $351,200 | $74,500 | $276,700 |
| 2014 | $834 | $282,800 | $74,500 | $208,300 |
Landlord's Agent in 2024
Sarah Abderrazzaq
Realty ONE Group Old Towne
(540) 273-2777
41 in this area
119 Total Sales
Seller's Agent in 2024
Shanon Levi
Samson Properties
(760) 792-9294
13 in this area
59 Total Sales
Tenant's Agent in 2024
Kimberly Schroeder
Long & Foster Real Estate, Inc.
(540) 877-6747
23 in this area
60 Total Sales
Seller's Agent in 2022
Lilyan Dickerson
Century 21 Redwood Realty
(703) 447-2636
1 in this area
11 Total Sales
Source: Bright MLS
MLS Number: VAFV2023102
APN: 64G2-1-48
Disclaimer: Certain information contained herein is derived from information provided by parties other than Homes.com. All information provided is deemed reliable, but is not guaranteed to be accurate and should be independently verified.
![]() The data relating to real estate for sale on this website appears in part through the BRIGHT Internet Data Exchange program, a voluntary cooperative exchange of property listing data between licensed real estate brokerage firms, and is provided by BRIGHT through a licensing agreement.
The data relating to real estate for sale on this website appears in part through the BRIGHT Internet Data Exchange program, a voluntary cooperative exchange of property listing data between licensed real estate brokerage firms, and is provided by BRIGHT through a licensing agreement.
Listing information is from various brokers who participate in the Bright MLS IDX program and not all listings may be visible on the site.
The property information being provided on or through the website is for the personal, non-commercial use of consumers and such information may not be used for any purpose other than to identify prospective properties consumers may be interested in purchasing.
Some properties which appear for sale on the website may no longer be available because they are for instance, under contract, sold or are no longer being offered for sale.
Property information displayed is deemed reliable but is not guaranteed.
Copyright 2026 Bright MLS, Inc.
Ask me questions while you tour the home.