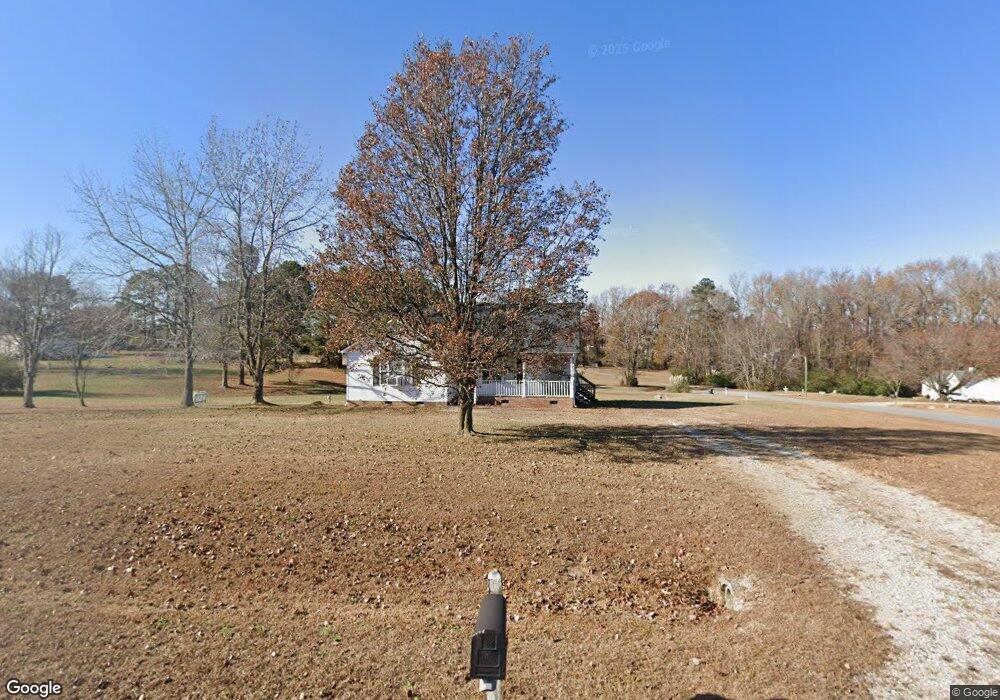
101 Wyndfall Ln Clayton, NC 27527
Estimated Value: $235,000 - $307,000
3
Beds
2
Baths
1,274
Sq Ft
$218/Sq Ft
Est. Value
About This Home
This home is located at 101 Wyndfall Ln, Clayton, NC 27527 and is currently estimated at $277,477, approximately $217 per square foot. 101 Wyndfall Ln is a home located in Johnston County with nearby schools including River Dell Elementary School, Archer Lodge Middle School, and Corinth Holders High School.
Ownership History
Date
Name
Owned For
Owner Type
Purchase Details
Closed on
Apr 5, 2012
Sold by
Phaby Christopher and Phaby Stacy
Bought by
Federal National Mortgage Association
Current Estimated Value
Purchase Details
Closed on
Dec 16, 2010
Sold by
Phaby Christopher and Phaby Stacy
Bought by
Phaby Christopher
Purchase Details
Closed on
Dec 29, 2006
Sold by
Novastar Mortgage Inc
Bought by
Mortgage Guaranty Insurance Corp
Home Financials for this Owner
Home Financials are based on the most recent Mortgage that was taken out on this home.
Original Mortgage
$106,650
Interest Rate
6.27%
Mortgage Type
Purchase Money Mortgage
Purchase Details
Closed on
Oct 4, 2006
Sold by
Dingus Jacqueline M
Bought by
Novastar Mortgage Inc
Purchase Details
Closed on
Oct 16, 2003
Sold by
Dingus Jacqueline M
Bought by
Dingus Jacqueline M
Create a Home Valuation Report for This Property
The Home Valuation Report is an in-depth analysis detailing your home's value as well as a comparison with similar homes in the area
Home Values in the Area
Average Home Value in this Area
Purchase History
| Date | Buyer | Sale Price | Title Company |
|---|---|---|---|
| Federal National Mortgage Association | $95,136 | None Available | |
| Phaby Christopher | -- | None Available | |
| Mortgage Guaranty Insurance Corp | $120,500 | None Available | |
| Novastar Mortgage Inc | $116,352 | None Available | |
| Dingus Jacqueline M | -- | -- |
Source: Public Records
Mortgage History
| Date | Status | Borrower | Loan Amount |
|---|---|---|---|
| Previous Owner | Mortgage Guaranty Insurance Corp | $106,650 |
Source: Public Records
Tax History Compared to Growth
Tax History
| Year | Tax Paid | Tax Assessment Tax Assessment Total Assessment is a certain percentage of the fair market value that is determined by local assessors to be the total taxable value of land and additions on the property. | Land | Improvement |
|---|---|---|---|---|
| 2025 | $2,160 | $263,470 | $80,000 | $183,470 |
| 2024 | $1,668 | $168,490 | $60,000 | $108,490 |
| 2023 | $1,668 | $168,490 | $60,000 | $108,490 |
| 2022 | $1,685 | $168,490 | $60,000 | $108,490 |
| 2021 | $1,601 | $168,490 | $60,000 | $108,490 |
| 2020 | $1,651 | $168,490 | $60,000 | $108,490 |
| 2019 | $1,651 | $168,490 | $60,000 | $108,490 |
| 2018 | $1,346 | $134,550 | $43,030 | $91,520 |
| 2017 | $1,319 | $134,550 | $43,030 | $91,520 |
| 2016 | $1,319 | $134,550 | $43,030 | $91,520 |
| 2015 | $1,251 | $134,550 | $43,030 | $91,520 |
| 2014 | $1,251 | $134,550 | $43,030 | $91,520 |
Source: Public Records
Map
Nearby Homes
- 35 Wheatfield Ln
- 100 Capanne Ct
- 81 Albereto Dr
- 160 Summerlin Dr
- 150 Summerlin Dr
- 593 Bent Willow Dr Unit 123
- 641 Bent Willow Dr
- 641 Bent Willow Dr Unit 128
- 276 Kentucky Dr
- 101 Richmond Dr
- 432 Bent Willow Dr
- 62 Summer Mist Ln Unit 167
- 80 Summer Mist Ln
- 80 Summer Mist Ln Unit 165p
- 92 Summer Mist Ln Unit 164p
- 27 Silver Moon Ln
- 376 Curling Creek Dr Unit 112p
- 303 Bent Willow Dr
- 225 Curling Creek Dr Unit 302p
- 303 Norwood Dr
- 67 Wyndfall Ln
- 53 Wyndfall Ln
- 69 Wyndfall Ln
- 57 Wyndfall Ln
- 55 Wyndfall Ln
- 79 Wyndfall Ln
- 85 Wyndfall Ln
- 91 Wyndfall Ln
- 59 Wyndfall Ln
- 93 Wyndfall Ln
- 83 Wyndfall Ln
- 75 Wyndfall Ln
- 63 Wyndfall Ln
- 73 Wyndfall Ln
- 95 Wyndfall Ln
- 43 Wyndfall Ln
- 105 Wyndfall Ln
- 107 Wyndfall Ln
- 101 Jacobs Ct
- 117 Wyndfall Ln