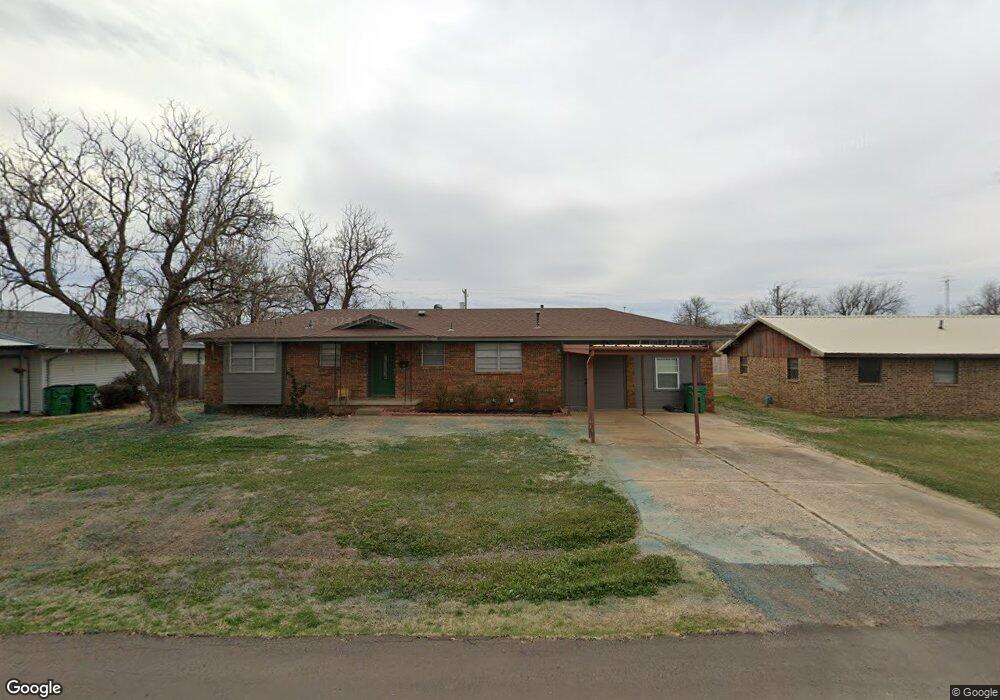
1010 10th St Snyder, OK 73566
Estimated Value: $103,000 - $121,000
3
Beds
2
Baths
1,560
Sq Ft
$74/Sq Ft
Est. Value
About This Home
This home is located at 1010 10th St, Snyder, OK 73566 and is currently estimated at $115,841, approximately $74 per square foot. 1010 10th St is a home located in Kiowa County with nearby schools including Snyder Elementary School and Snyder High School.
Ownership History
Date
Name
Owned For
Owner Type
Purchase Details
Closed on
May 31, 2018
Sold by
Babcock Robert B and Babcock Colene M
Bought by
Quickle Darek Hunter and Quickle Danielle Kaylyn
Current Estimated Value
Home Financials for this Owner
Home Financials are based on the most recent Mortgage that was taken out on this home.
Original Mortgage
$74,623
Outstanding Balance
$64,575
Interest Rate
4.62%
Mortgage Type
FHA
Estimated Equity
$51,266
Purchase Details
Closed on
Aug 13, 2007
Sold by
Babcock Robert and Babcock Colene
Bought by
Babcock Robert and Babcock Colene
Home Financials for this Owner
Home Financials are based on the most recent Mortgage that was taken out on this home.
Original Mortgage
$68,000
Interest Rate
6.72%
Create a Home Valuation Report for This Property
The Home Valuation Report is an in-depth analysis detailing your home's value as well as a comparison with similar homes in the area
Home Values in the Area
Average Home Value in this Area
Purchase History
| Date | Buyer | Sale Price | Title Company |
|---|---|---|---|
| Quickle Darek Hunter | $76,000 | Bailey S Abstract And Title | |
| Babcock Robert | -- | -- |
Source: Public Records
Mortgage History
| Date | Status | Borrower | Loan Amount |
|---|---|---|---|
| Open | Quickle Darek Hunter | $74,623 | |
| Previous Owner | Babcock Robert | $68,000 |
Source: Public Records
Tax History Compared to Growth
Tax History
| Year | Tax Paid | Tax Assessment Tax Assessment Total Assessment is a certain percentage of the fair market value that is determined by local assessors to be the total taxable value of land and additions on the property. | Land | Improvement |
|---|---|---|---|---|
| 2024 | $758 | $8,734 | $520 | $8,214 |
| 2023 | $721 | $8,318 | $520 | $7,798 |
| 2022 | $621 | $8,318 | $520 | $7,798 |
| 2021 | $621 | $8,318 | $520 | $7,798 |
| 2020 | $633 | $8,473 | $520 | $7,953 |
| 2019 | $633 | $8,473 | $520 | $7,953 |
| 2018 | $630 | $8,430 | $520 | $7,910 |
| 2017 | $607 | $8,160 | $520 | $7,640 |
| 2016 | $587 | $7,890 | $520 | $7,370 |
| 2015 | $594 | $7,970 | $520 | $7,450 |
| 2014 | $593 | $7,955 | $520 | $7,435 |
Source: Public Records
Map
Nearby Homes