1010 11th St Snyder, OK 73566
Estimated Value: $132,000 - $138,000
3
Beds
2
Baths
1,845
Sq Ft
$73/Sq Ft
Est. Value
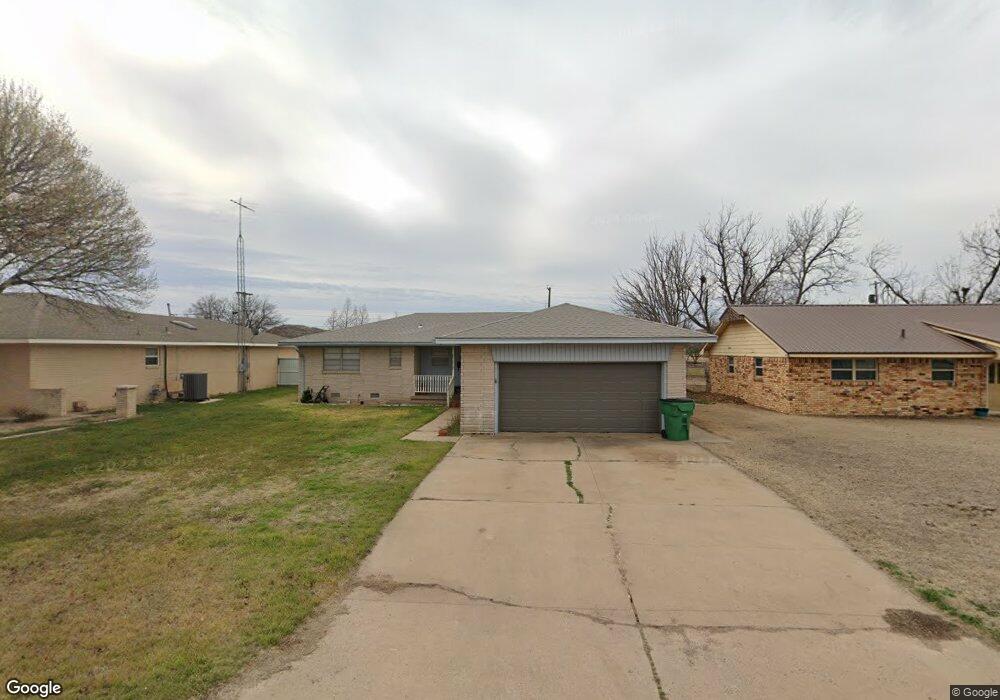
About This Home
This home is located at 1010 11th St, Snyder, OK 73566 and is currently estimated at $134,684, approximately $72 per square foot. 1010 11th St is a home located in Kiowa County with nearby schools including Snyder Elementary School and Snyder High School.
Ownership History
Date
Name
Owned For
Owner Type
Purchase Details
Closed on
Sep 8, 2017
Sold by
Alonzo Eusebio P and Alonzo Krystal
Bought by
Hawkins Jared
Current Estimated Value
Home Financials for this Owner
Home Financials are based on the most recent Mortgage that was taken out on this home.
Original Mortgage
$91,919
Outstanding Balance
$76,575
Interest Rate
3.9%
Mortgage Type
New Conventional
Estimated Equity
$58,109
Purchase Details
Closed on
Mar 10, 2010
Sold by
Brooks Oscar T and Brooks Linda S
Bought by
Alonzo Paul
Home Financials for this Owner
Home Financials are based on the most recent Mortgage that was taken out on this home.
Original Mortgage
$96,938
Interest Rate
4.97%
Create a Home Valuation Report for This Property
The Home Valuation Report is an in-depth analysis detailing your home's value as well as a comparison with similar homes in the area
Home Values in the Area
Average Home Value in this Area
Purchase History
| Date | Buyer | Sale Price | Title Company |
|---|---|---|---|
| Hawkins Jared | -- | None Available | |
| Alonzo Paul | -- | -- |
Source: Public Records
Mortgage History
| Date | Status | Borrower | Loan Amount |
|---|---|---|---|
| Open | Hawkins Jared | $91,919 | |
| Previous Owner | Alonzo Paul | $96,938 |
Source: Public Records
Tax History Compared to Growth
Tax History
| Year | Tax Paid | Tax Assessment Tax Assessment Total Assessment is a certain percentage of the fair market value that is determined by local assessors to be the total taxable value of land and additions on the property. | Land | Improvement |
|---|---|---|---|---|
| 2025 | $902 | $10,137 | $982 | $9,155 |
| 2024 | $902 | $11,394 | $982 | $10,412 |
| 2023 | $873 | $11,062 | $982 | $10,080 |
| 2022 | $751 | $11,062 | $982 | $10,080 |
| 2021 | $751 | $11,062 | $982 | $10,080 |
| 2020 | $751 | $11,062 | $982 | $10,080 |
| 2019 | $951 | $13,737 | $982 | $12,755 |
| 2018 | $996 | $13,337 | $982 | $12,355 |
| 2017 | $945 | $12,702 | $982 | $11,720 |
| 2016 | $900 | $12,097 | $982 | $11,115 |
| 2015 | $859 | $11,521 | $982 | $10,539 |
| 2014 | $818 | $10,972 | $982 | $9,990 |
Source: Public Records
Map
Nearby Homes