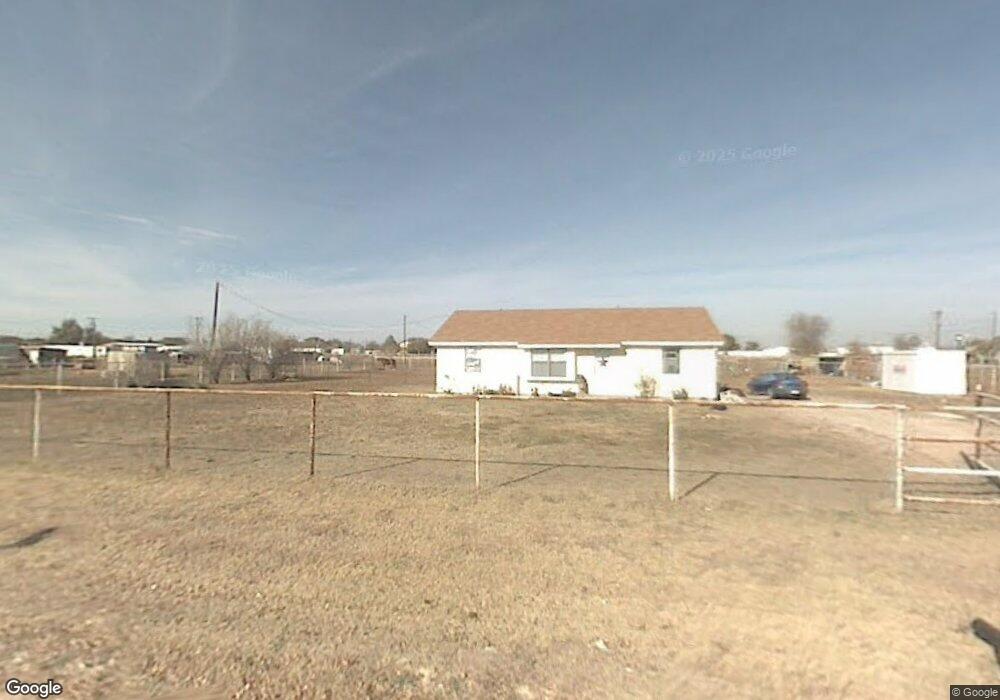
1010 134th St Lubbock, TX 79423
Far South Lubbock NeighborhoodEstimated Value: $162,000 - $198,000
3
Beds
1
Bath
1,232
Sq Ft
$142/Sq Ft
Est. Value
About This Home
This home is located at 1010 134th St, Lubbock, TX 79423 and is currently estimated at $175,007, approximately $142 per square foot. 1010 134th St is a home located in Lubbock County with nearby schools including Lubbock-Cooper East El, Lubbock-Cooper Middle School, and Lubbock-Cooper Liberty High School.
Ownership History
Date
Name
Owned For
Owner Type
Purchase Details
Closed on
Dec 7, 2011
Sold by
Bohannon Bob
Bought by
Garcia David
Current Estimated Value
Home Financials for this Owner
Home Financials are based on the most recent Mortgage that was taken out on this home.
Original Mortgage
$80,612
Outstanding Balance
$55,487
Interest Rate
4.14%
Mortgage Type
New Conventional
Estimated Equity
$119,520
Purchase Details
Closed on
Jul 23, 2003
Sold by
Edwards Annette Leigh
Bought by
Garcia David
Create a Home Valuation Report for This Property
The Home Valuation Report is an in-depth analysis detailing your home's value as well as a comparison with similar homes in the area
Home Values in the Area
Average Home Value in this Area
Purchase History
| Date | Buyer | Sale Price | Title Company |
|---|---|---|---|
| Garcia David | -- | Title One | |
| Garcia David | -- | -- |
Source: Public Records
Mortgage History
| Date | Status | Borrower | Loan Amount |
|---|---|---|---|
| Open | Garcia David | $80,612 |
Source: Public Records
Tax History Compared to Growth
Tax History
| Year | Tax Paid | Tax Assessment Tax Assessment Total Assessment is a certain percentage of the fair market value that is determined by local assessors to be the total taxable value of land and additions on the property. | Land | Improvement |
|---|---|---|---|---|
| 2025 | $593 | $132,574 | $3,975 | $128,599 |
| 2024 | $18 | $114,160 | $3,975 | $110,185 |
| 2023 | $1,620 | $99,725 | $3,975 | $95,750 |
| 2022 | $1,641 | $90,659 | $3,975 | $104,716 |
| 2021 | $1,534 | $82,417 | $3,975 | $78,442 |
| 2020 | $1,540 | $80,125 | $3,975 | $76,150 |
| 2019 | $1,458 | $72,841 | $3,975 | $68,866 |
| 2018 | $1,334 | $66,219 | $3,975 | $62,244 |
| 2017 | $1,238 | $61,376 | $3,975 | $57,401 |
| 2016 | $1,126 | $55,796 | $3,975 | $51,821 |
| 2015 | $694 | $50,724 | $3,975 | $46,749 |
| 2014 | $694 | $46,113 | $3,975 | $42,138 |
Source: Public Records
Map
Nearby Homes
- 3808 128th St
- 604 Fm 1585
- 1604 137th St
- 13804 Paris Ave
- 13704 Avenue Q
- 13701 Avenue R
- 1716 133rd St
- 1622 128th St
- 13601 Sherman Ave
- 6219 121st St
- 14105 Avenue R
- 13803 Sherman Ave
- 1939 County Road 7340
- 13202 Avenue T
- 1904 141st St
- 1905 141st St
- 2109 County Road 7820
- 2016 County Road 7820
- 2110 County Road 7820
- 2010 County Road 7820