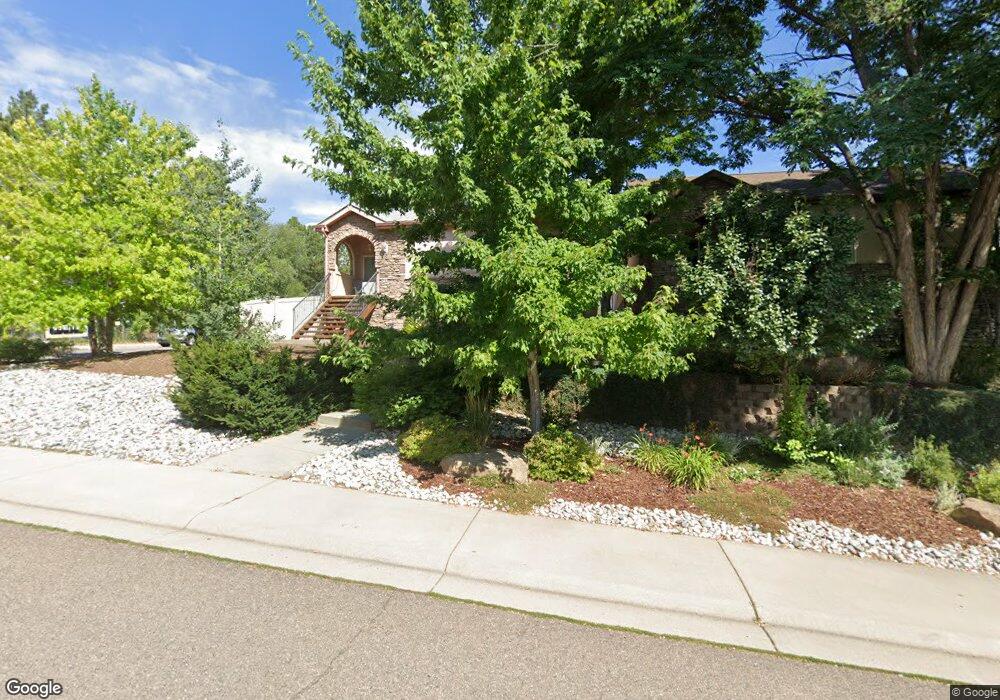
1010 20th St Golden, CO 80401
Welchs NeighborhoodEstimated Value: $857,000 - $1,200,000
5
Beds
3
Baths
2,969
Sq Ft
$360/Sq Ft
Est. Value
About This Home
This home is located at 1010 20th St, Golden, CO 80401 and is currently estimated at $1,070,210, approximately $360 per square foot. 1010 20th St is a home located in Jefferson County with nearby schools including Shelton Elementary School, Bell Middle School, and Golden High School.
Ownership History
Date
Name
Owned For
Owner Type
Purchase Details
Closed on
Jun 28, 2021
Sold by
Elliott Suzanne M and Coats Brian
Bought by
Elliott Suzanne M
Current Estimated Value
Home Financials for this Owner
Home Financials are based on the most recent Mortgage that was taken out on this home.
Original Mortgage
$301,500
Outstanding Balance
$252,220
Interest Rate
2.9%
Mortgage Type
New Conventional
Estimated Equity
$817,990
Purchase Details
Closed on
Apr 24, 2012
Sold by
Fannie Mae
Bought by
Elliott Suzanne M and Coats Brian
Home Financials for this Owner
Home Financials are based on the most recent Mortgage that was taken out on this home.
Original Mortgage
$400,610
Interest Rate
3.97%
Mortgage Type
New Conventional
Purchase Details
Closed on
Jan 24, 2012
Sold by
Songer Barbara M and Songer Paul A
Bought by
Fannie Mae and Federal National Mortgage Association
Purchase Details
Closed on
Mar 11, 2002
Sold by
Davis Leo F and Davis Lynda L
Bought by
Songer Paul A and Songer Barbara M
Create a Home Valuation Report for This Property
The Home Valuation Report is an in-depth analysis detailing your home's value as well as a comparison with similar homes in the area
Home Values in the Area
Average Home Value in this Area
Purchase History
| Date | Buyer | Sale Price | Title Company |
|---|---|---|---|
| Elliott Suzanne M | -- | First Integrity Title | |
| Elliott Suzanne M | $413,000 | None Available | |
| Fannie Mae | -- | None Available | |
| Songer Paul A | $80,000 | Land Title Guarantee Company |
Source: Public Records
Mortgage History
| Date | Status | Borrower | Loan Amount |
|---|---|---|---|
| Open | Elliott Suzanne M | $301,500 | |
| Closed | Elliott Suzanne M | $400,610 |
Source: Public Records
Tax History Compared to Growth
Tax History
| Year | Tax Paid | Tax Assessment Tax Assessment Total Assessment is a certain percentage of the fair market value that is determined by local assessors to be the total taxable value of land and additions on the property. | Land | Improvement |
|---|---|---|---|---|
| 2024 | $5,593 | $61,568 | $15,576 | $45,992 |
| 2023 | $5,593 | $61,568 | $15,576 | $45,992 |
| 2022 | $4,322 | $49,994 | $16,885 | $33,109 |
| 2021 | $4,392 | $51,433 | $17,371 | $34,062 |
| 2020 | $4,116 | $48,446 | $16,399 | $32,047 |
| 2019 | $4,057 | $48,446 | $16,399 | $32,047 |
| 2018 | $3,856 | $44,670 | $8,600 | $36,070 |
| 2017 | $3,493 | $44,670 | $8,600 | $36,070 |
| 2016 | $3,465 | $41,446 | $8,953 | $32,493 |
| 2015 | $3,336 | $41,446 | $8,953 | $32,493 |
| 2014 | $3,336 | $37,466 | $6,199 | $31,267 |
Source: Public Records
Map
Nearby Homes
- 2101 Arapahoe St
- 1020 24th St
- 521 21st St
- 1006 Homestake Dr Unit 1D
- 803 14th St Unit 803A
- 615 24th St Unit 103
- 615 24th St Unit 207
- 615 24th St Unit 105
- 403 18th St
- 510 16th St
- 1024 Cottonwood Cir
- 1220 Cheyenne St
- 1003 Cottonwood Cir
- 708 13th St Unit 250
- 1931 Foothills Rd
- 920 12th St
- 1203 Washington Ave Unit 205
- 1948 Sage Dr
- 620 11th St Unit 202
- 620 11th St Unit 206
- 1008 20th St
- 1006 20th St
- 2237 Illinois St
- 1004 20th St
- 1009 19th St
- 1007 19th St
- 1005 19th St
- 1103 19th St
- 2003 Illinois St
- 1003 19th St
- 1017 20th St
- 1000 20th St
- 1011 20th St
- 1005 20th St
- 1001 19th St
- 1001 19th St Unit 4
- 1001 19th St Unit 9
- 1001 19th St Unit 6
- 1001 19th St Unit 7
- 1001 19th St Unit 2