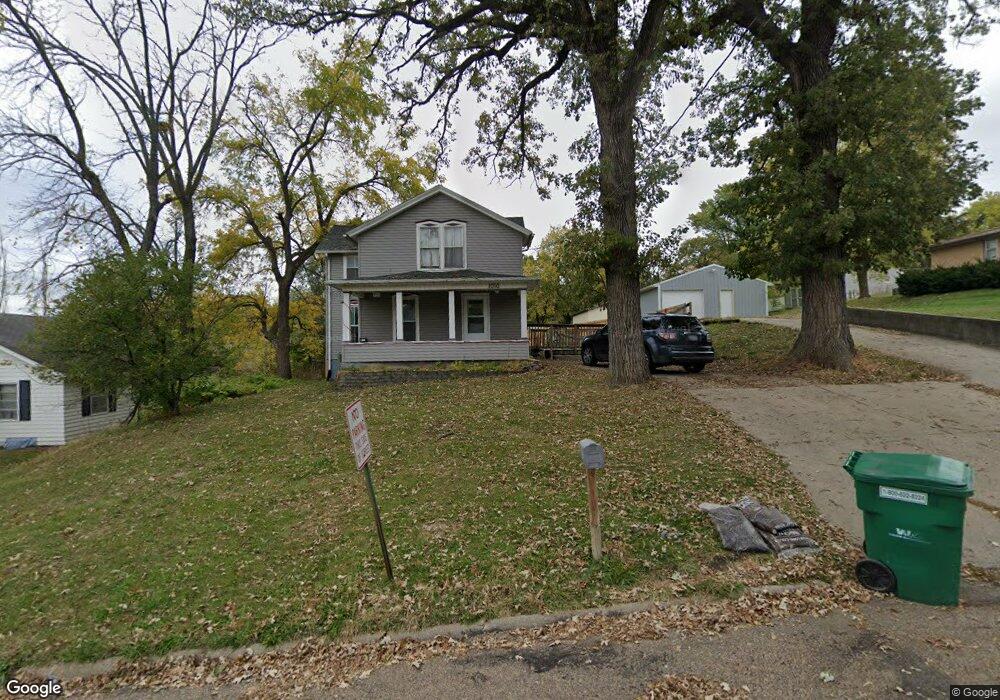
1010 7th St Corning, IA 50841
Estimated Value: $91,000 - $124,000
5
Beds
1
Bath
1,521
Sq Ft
$69/Sq Ft
Est. Value
About This Home
This home is located at 1010 7th St, Corning, IA 50841 and is currently estimated at $104,710, approximately $68 per square foot. 1010 7th St is a home located in Adams County.
Ownership History
Date
Name
Owned For
Owner Type
Purchase Details
Closed on
Aug 15, 2016
Sold by
Kuhn Jimmy D and Kuhn Kim
Bought by
Johnson Ethan C and Johnson Daryan A
Current Estimated Value
Home Financials for this Owner
Home Financials are based on the most recent Mortgage that was taken out on this home.
Original Mortgage
$78,551
Outstanding Balance
$62,018
Interest Rate
3.41%
Mortgage Type
New Conventional
Estimated Equity
$42,692
Create a Home Valuation Report for This Property
The Home Valuation Report is an in-depth analysis detailing your home's value as well as a comparison with similar homes in the area
Purchase History
We collect this data history from publicly available records. To have your information removed, we recommend requesting removal directly through your county’s website.
| Date | Buyer | Sale Price | Title Company |
|---|---|---|---|
| Johnson Ethan C | $80,000 | Midwest Cmnty Title |
Source: Public Records
Mortgage History
We collect this data history from publicly available records. To have your information removed, we recommend requesting removal directly through your county’s website.
| Date | Status | Borrower | Loan Amount |
|---|---|---|---|
| Open | Johnson Ethan C | $78,551 |
Source: Public Records
Tax History
| Year | Tax Paid | Tax Assessment Tax Assessment Total Assessment is a certain percentage of the fair market value that is determined by local assessors to be the total taxable value of land and additions on the property. | Land | Improvement |
|---|---|---|---|---|
| 2025 | $1,894 | $99,700 | $8,300 | $91,400 |
| 2024 | $1,894 | $95,500 | $8,300 | $87,200 |
| 2023 | $1,842 | $95,500 | $8,300 | $87,200 |
| 2022 | $1,558 | $71,700 | $8,300 | $63,400 |
| 2021 | $1,514 | $63,100 | $3,100 | $60,000 |
| 2020 | $1,544 | $63,100 | $3,100 | $60,000 |
| 2019 | $1,544 | $63,178 | $0 | $0 |
| 2018 | $1,520 | $63,178 | $0 | $0 |
| 2017 | $1,098 | $53,166 | $0 | $0 |
| 2016 | $1,074 | $53,166 | $0 | $0 |
| 2015 | $862 | $44,305 | $0 | $0 |
| 2014 | $810 | $44,305 | $0 | $0 |
Source: Public Records
Map
Nearby Homes
Your Personal Tour Guide
Ask me questions while you tour the home.