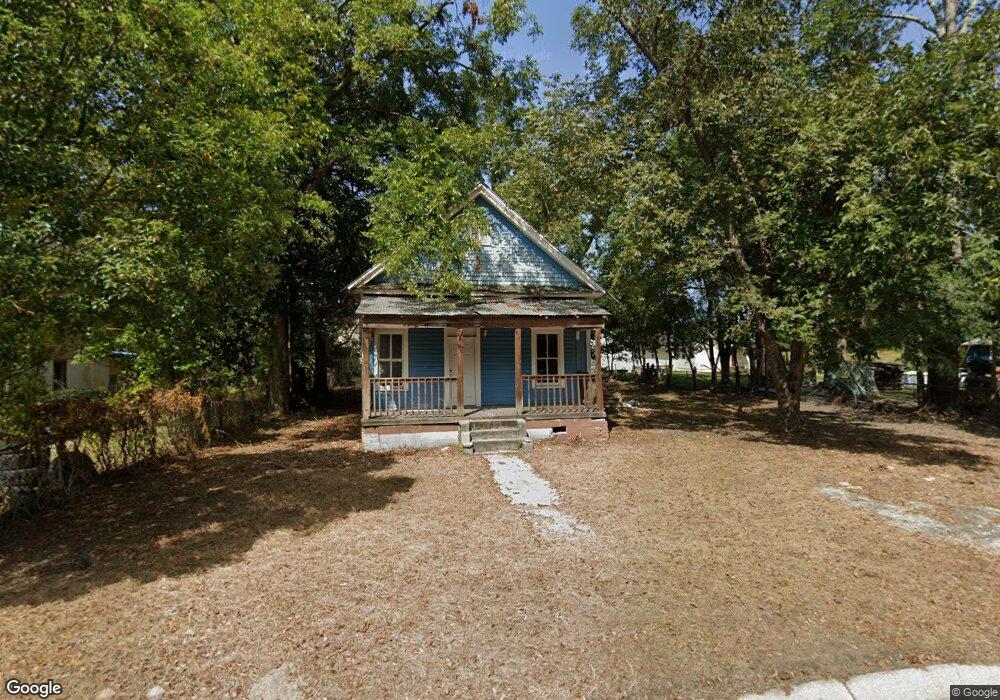
1010 Ann St Waycross, GA 31503
Estimated Value: $50,000 - $117,000
3
Beds
1
Bath
1,490
Sq Ft
$52/Sq Ft
Est. Value
About This Home
This home is located at 1010 Ann St, Waycross, GA 31503 and is currently estimated at $77,026, approximately $51 per square foot. 1010 Ann St is a home located in Ware County with nearby schools including Ruskin Elementary School, Ware County Middle School, and Ware County High School.
Ownership History
Date
Name
Owned For
Owner Type
Purchase Details
Closed on
Feb 8, 2024
Sold by
Lay Jeffery Scott
Bought by
Contreras Perez Analicia
Current Estimated Value
Purchase Details
Closed on
Aug 13, 2014
Sold by
Harden Jessie Ruth
Bought by
Harden Daniel and Bailey Leila Harden
Home Financials for this Owner
Home Financials are based on the most recent Mortgage that was taken out on this home.
Original Mortgage
$60,000
Interest Rate
4.17%
Mortgage Type
New Conventional
Purchase Details
Closed on
Jun 18, 2014
Sold by
Dollar Jimmy
Bought by
Lay Jeffery S
Home Financials for this Owner
Home Financials are based on the most recent Mortgage that was taken out on this home.
Original Mortgage
$60,000
Interest Rate
4.17%
Mortgage Type
New Conventional
Purchase Details
Closed on
Jan 22, 2009
Sold by
Tuten Royce Lonnie
Bought by
Dollar Jimmy Malcom
Purchase Details
Closed on
May 5, 2000
Sold by
Tuten Talmadge J
Bought by
Arnold Royce and Arnold Ray
Purchase Details
Closed on
Feb 21, 1992
Bought by
Tuten Talmadge J
Create a Home Valuation Report for This Property
The Home Valuation Report is an in-depth analysis detailing your home's value as well as a comparison with similar homes in the area
Home Values in the Area
Average Home Value in this Area
Purchase History
| Date | Buyer | Sale Price | Title Company |
|---|---|---|---|
| Contreras Perez Analicia | $8,000 | -- | |
| Harden Daniel | -- | -- | |
| Lay Jeffery S | $2,800 | -- | |
| Dollar Jimmy Malcom | -- | -- | |
| Arnold Royce | -- | -- | |
| Tuten Talmadge J | -- | -- |
Source: Public Records
Tax History Compared to Growth
Tax History
| Year | Tax Paid | Tax Assessment Tax Assessment Total Assessment is a certain percentage of the fair market value that is determined by local assessors to be the total taxable value of land and additions on the property. | Land | Improvement |
|---|---|---|---|---|
| 2024 | $316 | $9,174 | $1,258 | $7,916 |
| 2023 | $316 | $7,377 | $625 | $6,752 |
| 2022 | $294 | $7,377 | $625 | $6,752 |
| 2021 | $205 | $4,747 | $625 | $4,122 |
| 2020 | $204 | $4,673 | $625 | $4,048 |
| 2019 | $198 | $4,489 | $625 | $3,864 |
| 2018 | $192 | $4,305 | $625 | $3,680 |
| 2017 | $188 | $4,305 | $625 | $3,680 |
| 2016 | $188 | $4,305 | $625 | $3,680 |
| 2015 | $49 | $4,304 | $625 | $3,680 |
| 2014 | $185 | $4,215 | $625 | $3,590 |
| 2013 | -- | $4,214 | $624 | $3,590 |
Source: Public Records
Map
Nearby Homes
- 1125 Georgia St
- 1208 Jane St
- 807 Elizabeth St
- 803 Elizabeth St
- 503 N Nicholls St
- 505 N Nicholls St
- 805
- 506 McDonald St
- 803 Bertha St
- 801 Bertha St
- 601 N Nicholls St
- 1322 Jane St
- 516 Folks St
- 0 S Georgia Pkwy W
- 605 Walker St
- 1306 Carswell Ave
- 617 Ware St
- 1401 Carswell Ave
- 1006 Roosevelt St
- 0 Camp Branch Cross Rd Unit 12958956
- 1012 Ann St
- 1004 Ann St
- 1014 Ann St
- 1005 Margaret St
- 1009 Margaret St
- 1003 Margaret St
- 1011 Margaret St
- 1016 Ann St
- 1011 Ann St
- 1005 Ann St
- 11111111 111111111111111
- 1013 Margaret St
- 202 S Nicholls St
- 300 N Nicholls St
- 306 S Nicholls St
- 1010 Georgia St
- 1012 Georgia St
- 1008 Georgia St
- 1016 Georgia St
- 1018 Georgia St