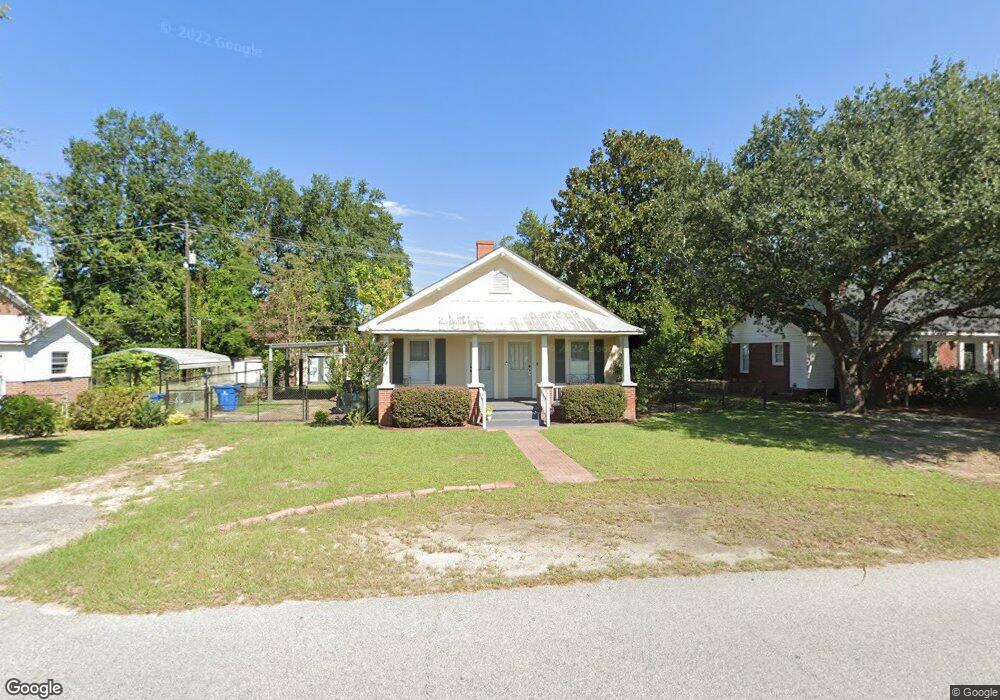
1010 Augusta St West Columbia, SC 29169
Estimated Value: $204,000 - $243,000
2
Beds
2
Baths
1,200
Sq Ft
$191/Sq Ft
Est. Value
About This Home
This home is located at 1010 Augusta St, West Columbia, SC 29169 and is currently estimated at $228,799, approximately $190 per square foot. 1010 Augusta St is a home located in Lexington County with nearby schools including Cayce Elementary, Cyril B. Busbee Creative Arts Academy, and Brookland-Cayce High School.
Ownership History
Date
Name
Owned For
Owner Type
Purchase Details
Closed on
Apr 13, 2022
Sold by
Kent Cales Iv Robert
Bought by
Loggins Patricia K and Loggins Michael G
Current Estimated Value
Purchase Details
Closed on
Oct 1, 2013
Sold by
Hoffman April Nicole and Fulwood April Hoffman
Bought by
Cales Robert Kent
Home Financials for this Owner
Home Financials are based on the most recent Mortgage that was taken out on this home.
Original Mortgage
$5,000
Interest Rate
4.5%
Mortgage Type
FHA
Purchase Details
Closed on
Jun 7, 2007
Sold by
Carter Joan B
Bought by
Hoffman April Nicole
Purchase Details
Closed on
Feb 15, 2005
Sold by
Carter Joan B
Bought by
Hoffman April Nicole
Home Financials for this Owner
Home Financials are based on the most recent Mortgage that was taken out on this home.
Original Mortgage
$81,200
Interest Rate
5.69%
Mortgage Type
Future Advance Clause Open End Mortgage
Create a Home Valuation Report for This Property
The Home Valuation Report is an in-depth analysis detailing your home's value as well as a comparison with similar homes in the area
Home Values in the Area
Average Home Value in this Area
Purchase History
| Date | Buyer | Sale Price | Title Company |
|---|---|---|---|
| Loggins Patricia K | $189,600 | None Listed On Document | |
| Cales Robert Kent | $137,000 | -- | |
| Hoffman April Nicole | -- | None Available | |
| Hoffman April Nicole | $101,500 | -- |
Source: Public Records
Mortgage History
| Date | Status | Borrower | Loan Amount |
|---|---|---|---|
| Previous Owner | Cales Robert Kent | $5,000 | |
| Previous Owner | Hoffman April Nicole | $81,200 |
Source: Public Records
Tax History Compared to Growth
Tax History
| Year | Tax Paid | Tax Assessment Tax Assessment Total Assessment is a certain percentage of the fair market value that is determined by local assessors to be the total taxable value of land and additions on the property. | Land | Improvement |
|---|---|---|---|---|
| 2024 | $957 | $7,584 | $1,520 | $6,064 |
| 2023 | $948 | $5,460 | $1,520 | $3,940 |
| 2022 | $999 | $5,460 | $1,520 | $3,940 |
| 2020 | $1,012 | $5,460 | $1,520 | $3,940 |
| 2019 | $1,036 | $5,480 | $1,400 | $4,080 |
| 2018 | $1,047 | $5,480 | $1,400 | $4,080 |
| 2017 | $1,005 | $5,480 | $1,400 | $4,080 |
| 2016 | $1,033 | $5,480 | $1,400 | $4,080 |
| 2014 | $786 | $5,480 | $1,400 | $4,080 |
| 2013 | -- | $5,820 | $2,100 | $3,720 |
Source: Public Records
Map
Nearby Homes
- 1014 Augusta St
- 1006 Augusta St
- 1009 Center St
- 1022 Augusta St
- 1020 Augusta St
- 1007 Center St
- 1000 Augusta St
- 1015 Center St
- 1001 Center St
- 1024 Augusta St
- 1019 Center St
- 1030 Augusta St
- 935 Augusta St
- 933 Center St
- 1031 Center St
- 1029 Augusta St
- 1038 Augusta St
- 1022 Center St
- 926 Augusta St
- 1040 Augusta St