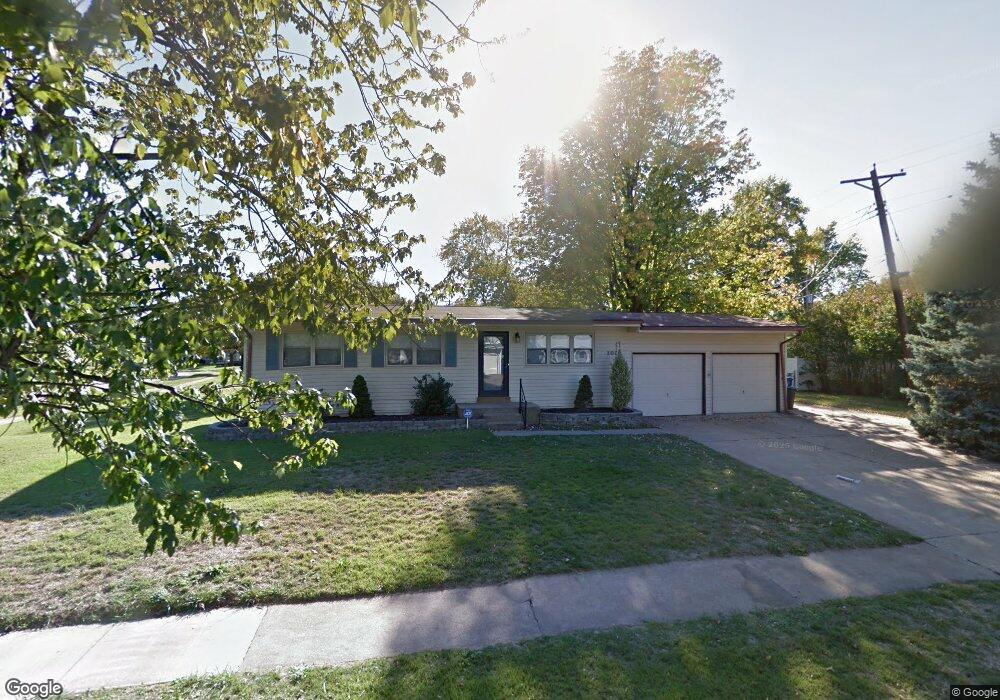
1010 Bellarmine Ln Florissant, MO 63031
Estimated Value: $180,000 - $210,000
3
Beds
3
Baths
960
Sq Ft
$196/Sq Ft
Est. Value
About This Home
This home is located at 1010 Bellarmine Ln, Florissant, MO 63031 and is currently estimated at $188,379, approximately $196 per square foot. 1010 Bellarmine Ln is a home located in St. Louis County with nearby schools including McNair Elementary School, Northwest Middle School, and Hazelwood West High School.
Ownership History
Date
Name
Owned For
Owner Type
Purchase Details
Closed on
Oct 24, 2011
Sold by
Chapman Properties Corp
Bought by
Fowler Kary Y
Current Estimated Value
Home Financials for this Owner
Home Financials are based on the most recent Mortgage that was taken out on this home.
Original Mortgage
$100,388
Outstanding Balance
$69,775
Interest Rate
4.5%
Mortgage Type
FHA
Estimated Equity
$118,604
Purchase Details
Closed on
May 3, 2011
Sold by
Obryan Aubrey Redick and Stalnaker Karen
Bought by
Chapman Properties Corp
Purchase Details
Closed on
Apr 27, 2007
Sold by
Stalnaker Sally A
Bought by
Stalnaker Karen M
Home Financials for this Owner
Home Financials are based on the most recent Mortgage that was taken out on this home.
Original Mortgage
$75,000
Interest Rate
6.13%
Mortgage Type
Purchase Money Mortgage
Purchase Details
Closed on
Dec 7, 1998
Sold by
Stalnaker Sally A
Bought by
Bohman Jean A and Stalnaker James D
Create a Home Valuation Report for This Property
The Home Valuation Report is an in-depth analysis detailing your home's value as well as a comparison with similar homes in the area
Home Values in the Area
Average Home Value in this Area
Purchase History
| Date | Buyer | Sale Price | Title Company |
|---|---|---|---|
| Fowler Kary Y | $103,000 | Atc | |
| Chapman Properties Corp | $39,000 | None Available | |
| Stalnaker Karen M | $100,000 | Title Professionals Llc | |
| Bohman Jean A | -- | -- |
Source: Public Records
Mortgage History
| Date | Status | Borrower | Loan Amount |
|---|---|---|---|
| Open | Fowler Kary Y | $100,388 | |
| Previous Owner | Stalnaker Karen M | $75,000 |
Source: Public Records
Tax History Compared to Growth
Tax History
| Year | Tax Paid | Tax Assessment Tax Assessment Total Assessment is a certain percentage of the fair market value that is determined by local assessors to be the total taxable value of land and additions on the property. | Land | Improvement |
|---|---|---|---|---|
| 2025 | $2,797 | $33,710 | $6,140 | $27,570 |
| 2024 | $2,797 | $31,330 | $3,150 | $28,180 |
| 2023 | $2,797 | $31,330 | $3,150 | $28,180 |
| 2022 | $2,389 | $23,850 | $4,560 | $19,290 |
| 2021 | $2,327 | $23,850 | $4,560 | $19,290 |
| 2020 | $2,177 | $20,960 | $3,520 | $17,440 |
| 2019 | $2,144 | $20,960 | $3,520 | $17,440 |
| 2018 | $1,960 | $17,600 | $2,950 | $14,650 |
| 2017 | $1,958 | $17,600 | $2,950 | $14,650 |
| 2016 | $1,942 | $17,220 | $2,950 | $14,270 |
| 2015 | $1,901 | $17,220 | $2,950 | $14,270 |
| 2014 | $1,946 | $18,180 | $3,910 | $14,270 |
Source: Public Records
Map
Nearby Homes
- 10 Garnier Ct
- 1060 Florland Dr
- 790 Manresa Ln
- 1065 Keeven Ln
- 1160 Kostka Ln
- 900 Gladiola Dr
- 1085 Campion Ln
- 912 Shamrock Dr
- 655 Florland Dr
- 700 Kostka Ln
- 519 White Birch Way
- 541 White Birch Way
- 710 Thompson Dr
- 1978 Acorn Trail Dr
- 523 Foxtrail Dr
- 619 Rosetta Dr
- 1495 Yaqui Dr
- 1565 Yaqui Dr
- 7435 Foxtrail Dr
- 7565 English Coach Ln
- 815 Canisius Ln
- 1020 Bellarmine Ln
- 1030 Bellarmine Ln
- 1005 Bellarmine Ln
- 1005 Berchmans Ln
- 940 Bellarmine Ln
- 1015 Bellarmine Ln
- 1015 Berchmans Ln
- 60 Canisius Ln
- 1025 Berchmans Ln
- 1025 Bellarmine Ln
- 1040 Bellarmine Ln
- 30 Canisius Ln
- 1035 Berchmans Ln
- 70 Canisius Ln
- 1035 Bellarmine Ln
- 920 Bellarmine Ln
- 1050 Bellarmine Ln
- 1045 Berchmans Ln
- 935 Bellarmine Ln