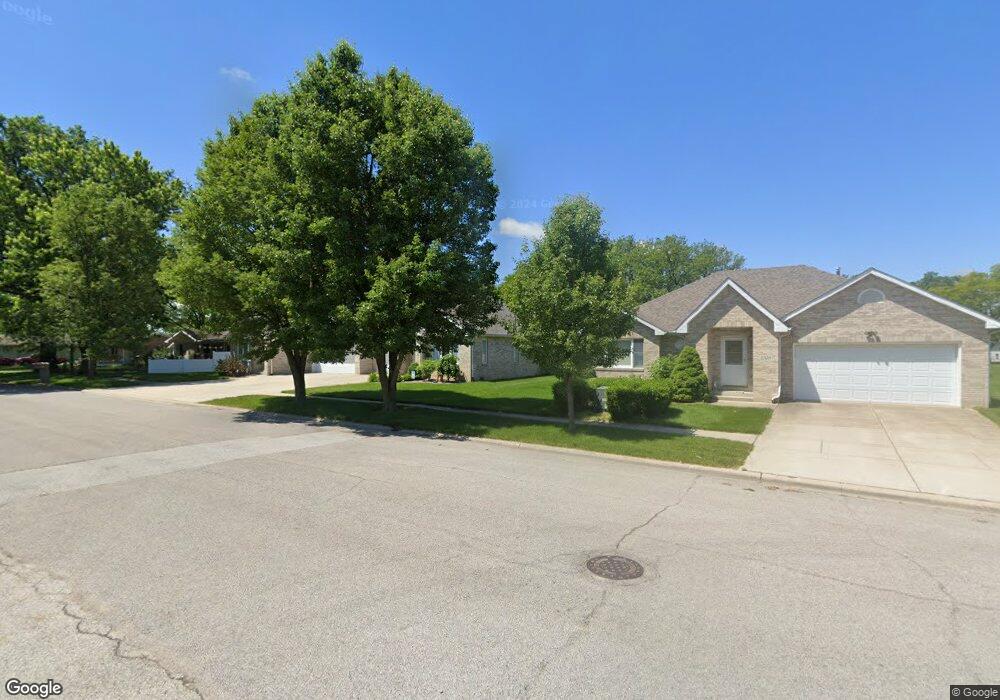
1010 Carnation St SE Demotte, IN 46310
Keener NeighborhoodEstimated Value: $256,000 - $304,000
2
Beds
2
Baths
1,447
Sq Ft
$189/Sq Ft
Est. Value
About This Home
This home is located at 1010 Carnation St SE, Demotte, IN 46310 and is currently estimated at $273,457, approximately $188 per square foot. 1010 Carnation St SE is a home located in Jasper County with nearby schools including Kankakee Valley High School, DeMotte Christian School, and DeMotte Christian High School.
Ownership History
Date
Name
Owned For
Owner Type
Purchase Details
Closed on
Aug 13, 2024
Sold by
Bailey Steven C and Bailey Charlene E
Bought by
Steven C Bailey And Charlene E Bailey Revocab and Bailey
Current Estimated Value
Purchase Details
Closed on
Nov 21, 2023
Sold by
Yozman Michael and Yozman Linda
Bought by
Clark Lisa D
Home Financials for this Owner
Home Financials are based on the most recent Mortgage that was taken out on this home.
Original Mortgage
$185,000
Interest Rate
7.57%
Mortgage Type
New Conventional
Purchase Details
Closed on
Mar 1, 2023
Sold by
Clark Lisa D
Bought by
Bailey Steven C and Bailey Charlene E
Purchase Details
Closed on
Sep 8, 2017
Sold by
Estate Of Lora P Alexander A/K/A Lora Patrici
Bought by
Michael Yozman
Create a Home Valuation Report for This Property
The Home Valuation Report is an in-depth analysis detailing your home's value as well as a comparison with similar homes in the area
Home Values in the Area
Average Home Value in this Area
Purchase History
| Date | Buyer | Sale Price | Title Company |
|---|---|---|---|
| Steven C Bailey And Charlene E Bailey Revocab | -- | None Listed On Document | |
| Clark Lisa D | -- | None Listed On Document | |
| Bailey Steven C | -- | State Street Title | |
| Michael Yozman | $135,000 | -- | |
| Yozman Michael | $135,000 | Northwest Indiana Title |
Source: Public Records
Mortgage History
| Date | Status | Borrower | Loan Amount |
|---|---|---|---|
| Previous Owner | Clark Lisa D | $185,000 |
Source: Public Records
Tax History Compared to Growth
Tax History
| Year | Tax Paid | Tax Assessment Tax Assessment Total Assessment is a certain percentage of the fair market value that is determined by local assessors to be the total taxable value of land and additions on the property. | Land | Improvement |
|---|---|---|---|---|
| 2024 | $1,691 | $246,800 | $23,000 | $223,800 |
| 2023 | $1,030 | $182,100 | $23,000 | $159,100 |
| 2022 | $938 | $148,600 | $20,000 | $128,600 |
| 2021 | $933 | $139,800 | $18,500 | $121,300 |
| 2020 | $950 | $137,100 | $18,500 | $118,600 |
| 2019 | $1,018 | $132,800 | $18,500 | $114,300 |
| 2018 | $840 | $129,300 | $18,500 | $110,800 |
| 2017 | $801 | $126,200 | $18,500 | $107,700 |
| 2016 | $621 | $135,200 | $18,500 | $116,700 |
| 2014 | $574 | $134,300 | $18,500 | $115,800 |
Source: Public Records
Map
Nearby Homes
- 11355 N E 580
- 212 8th St SE
- 122 9th St SW
- 104 15th St SE
- 641 D Begonia St SE
- 16 16th St SE
- 605 Begonia St SE Unit B
- 1611 Elderberry St SE
- 401 10th St SW
- 1622 Elderberry St SE
- 411 17th St SE
- 1709 Daisy St SE
- 1806 Forsythia St SE
- 712 Elm Ct SW
- 821 9th St SW Unit 10b
- 901 9th St SW Unit 8b
- 313 Carnation Ave NE
- 2004 Hickory St SW
- 2020 Hickory St SW
- 1905 Juniper St SW
- 1010 Carnation St SE Unit A
- 1010 Carnation St SE Unit B
- 1010 Carnation St SE
- 1008 Carnation St SE
- 1106 Carnation St SE
- 1006 Carnation St SE
- 1114 Carnation St SE
- 1101 Begonia St SE
- 1004 Carnation St SE
- 1105 Carnation St SE
- 1007 Carnation St SE
- 1113 Begonia St SE
- 305 11th Cir SE
- 1005 Carnation St SE Unit B
- 1005 Carnation St SE Unit A
- 1005 Carnation St SE
- 1005 Carnation St SE
- 1121 Begonia St SE
- 1002 Carnation St SE Unit B
- 1002 Carnation St SE