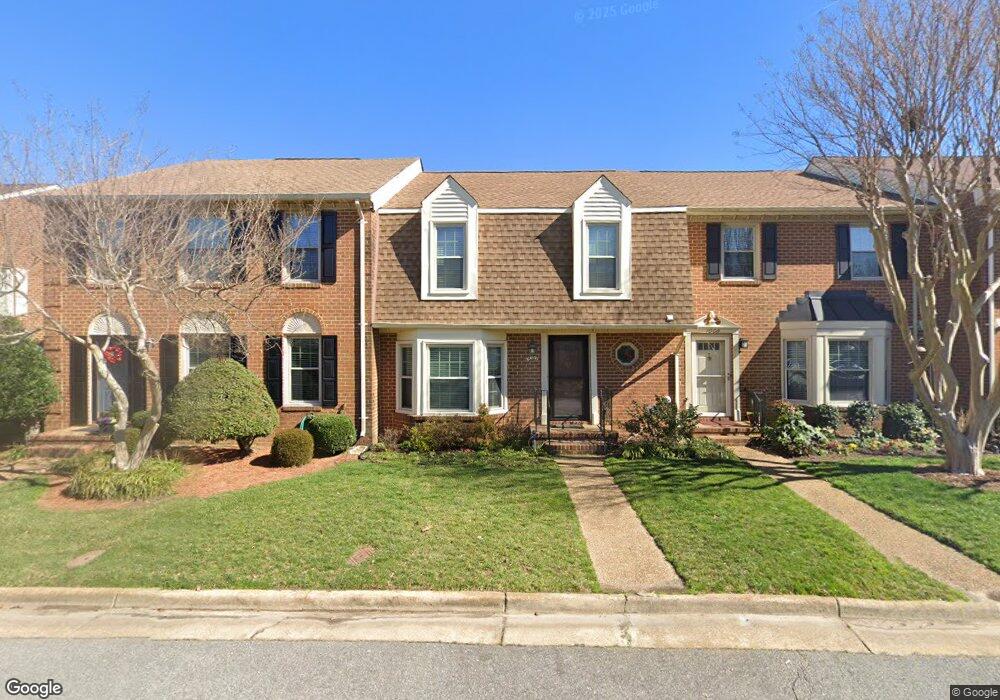
1010 Colonial Meadows Way Virginia Beach, VA 23454
Great Neck NeighborhoodEstimated Value: $410,000 - $443,000
3
Beds
3
Baths
1,882
Sq Ft
$226/Sq Ft
Est. Value
About This Home
This home is located at 1010 Colonial Meadows Way, Virginia Beach, VA 23454 and is currently estimated at $426,034, approximately $226 per square foot. 1010 Colonial Meadows Way is a home located in Virginia Beach City with nearby schools including Alanton Elementary School, Lynnhaven Middle School, and First Colonial High School.
Ownership History
Date
Name
Owned For
Owner Type
Purchase Details
Closed on
Jun 26, 2017
Sold by
Jones Sibylla M
Bought by
Richmond Donald G
Current Estimated Value
Purchase Details
Closed on
Aug 31, 2015
Sold by
Blanks Lillian Reynolds
Bought by
Jones Sibylla M
Home Financials for this Owner
Home Financials are based on the most recent Mortgage that was taken out on this home.
Original Mortgage
$166,000
Interest Rate
4.07%
Mortgage Type
New Conventional
Purchase Details
Closed on
Dec 5, 2001
Sold by
Mckinley Susan J
Bought by
Blanks Lillin R
Purchase Details
Closed on
Jun 14, 2000
Sold by
Tysor Stepheany D
Bought by
Mckinley Susan J
Home Financials for this Owner
Home Financials are based on the most recent Mortgage that was taken out on this home.
Original Mortgage
$137,655
Interest Rate
8.24%
Create a Home Valuation Report for This Property
The Home Valuation Report is an in-depth analysis detailing your home's value as well as a comparison with similar homes in the area
Home Values in the Area
Average Home Value in this Area
Purchase History
| Date | Buyer | Sale Price | Title Company |
|---|---|---|---|
| Richmond Donald G | $285,000 | Attorney | |
| Jones Sibylla M | $246,000 | None Available | |
| Blanks Lillin R | $150,900 | -- | |
| Mckinley Susan J | $144,900 | -- |
Source: Public Records
Mortgage History
| Date | Status | Borrower | Loan Amount |
|---|---|---|---|
| Previous Owner | Jones Sibylla M | $166,000 | |
| Previous Owner | Mckinley Susan J | $137,655 |
Source: Public Records
Tax History Compared to Growth
Tax History
| Year | Tax Paid | Tax Assessment Tax Assessment Total Assessment is a certain percentage of the fair market value that is determined by local assessors to be the total taxable value of land and additions on the property. | Land | Improvement |
|---|---|---|---|---|
| 2025 | $3,561 | $391,000 | $145,000 | $246,000 |
| 2024 | $3,561 | $367,100 | $145,000 | $222,100 |
| 2023 | $3,536 | $357,200 | $135,000 | $222,200 |
| 2022 | $3,199 | $323,100 | $115,000 | $208,100 |
| 2021 | $3,030 | $306,100 | $98,000 | $208,100 |
| 2020 | $2,977 | $292,600 | $98,000 | $194,600 |
| 2019 | $2,801 | $272,000 | $98,000 | $174,000 |
| 2018 | $2,727 | $272,000 | $98,000 | $174,000 |
| 2017 | $2,493 | $248,700 | $91,000 | $157,700 |
| 2016 | $2,410 | $243,400 | $90,300 | $153,100 |
| 2015 | $2,424 | $244,800 | $103,700 | $141,100 |
| 2014 | $2,381 | $251,200 | $109,800 | $141,400 |
Source: Public Records
Map
Nearby Homes
- 909 Royal Cove Way
- MM Chelsea @ Prosperity
- MM Woodside @ Prosperity
- The Chelsea Plan at Prosperity At The Pines
- The Leigh Plan at Prosperity At The Pines
- The Harriet Plan at Prosperity At The Pines
- The Dimitri Plan at Prosperity At The Pines
- The Savannah Plan at Prosperity At The Pines
- The Augusta Plan at Prosperity At The Pines
- 1833 Chantilly Ct Unit 305
- 1500 Horse Point Ct
- 1501 N Horseshoe Cir
- 1880 Chantilly Ct Unit 1001
- 914 Wildwood Square Ct
- 1877 Calash Way
- 813 Ray Place
- 1049 Hanson Way
- 932 N Hilltop Rd
- 1024 Autumn Woods Ln Unit 111
- 1513 Quail Point Rd
- 1008 Colonial Meadows Way
- 1012 Colonial Meadows Way
- 1006 Colonial Meadows Way
- 1014 Colonial Meadows Way
- 1004 Colonial Meadows Way
- 1002 Colonial Meadows Way
- 1016 Colonial Meadows Way
- 1018 Colonial Meadows Way
- 1000 Colonial Meadows Way
- 1020 Colonial Meadows Way
- 933 Lindsley Dr
- 1022 Colonial Meadows Way
- 929 Lindsley Dr
- 1011 Colonial Meadows Way
- 1009 Colonial Meadows Way
- 1013 Colonial Meadows Way
- 1007 Colonial Meadows Way
- 1015 Colonial Meadows Way
- 1005 Colonial Meadows Way
- 998 Colonial Meadows Way