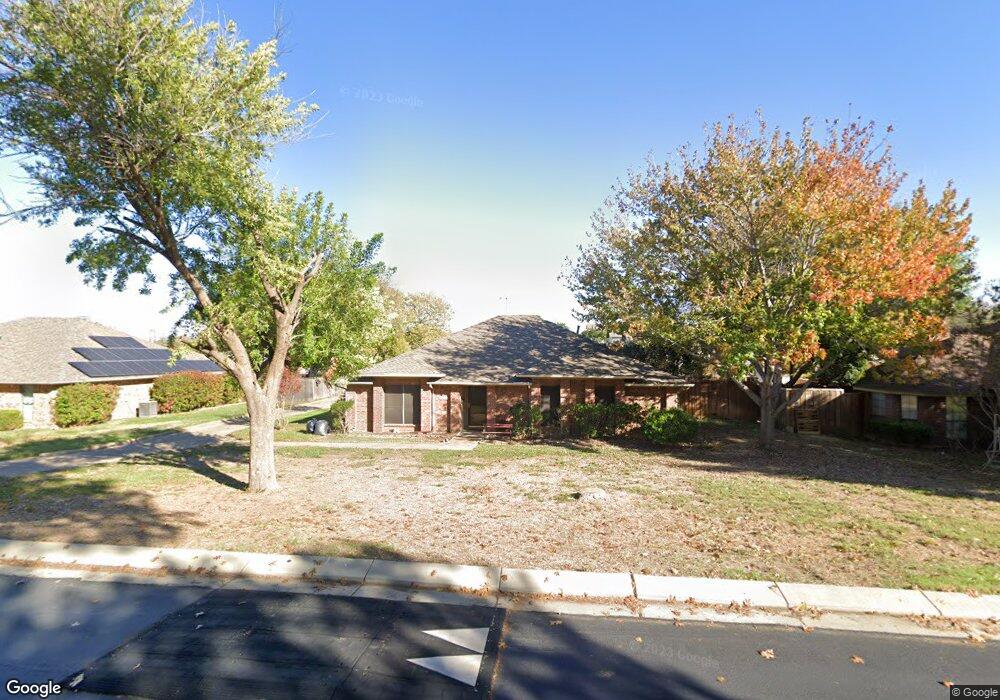
1010 Cook Dr Grand Prairie, TX 75050
Estimated Value: $269,000 - $410,000
3
Beds
2
Baths
1,884
Sq Ft
$181/Sq Ft
Est. Value
About This Home
This home is located at 1010 Cook Dr, Grand Prairie, TX 75050 and is currently estimated at $341,324, approximately $181 per square foot. 1010 Cook Dr is a home located in Dallas County with nearby schools including Stephen F. Austin Elementary School, Crosswinds High School, and Digital Arts & Technology Academy at Adams Middle.
Ownership History
Date
Name
Owned For
Owner Type
Purchase Details
Closed on
Jul 25, 2011
Sold by
Stripe Richard B
Bought by
Stripe Richard B and Stripe Patricia J
Current Estimated Value
Purchase Details
Closed on
Jun 13, 2005
Sold by
Stripe Shannon R
Bought by
Stripe Richard B
Purchase Details
Closed on
Aug 18, 1999
Sold by
King Debra K
Bought by
Stripe Richard B and Stripe Shannon R
Home Financials for this Owner
Home Financials are based on the most recent Mortgage that was taken out on this home.
Original Mortgage
$60,900
Interest Rate
7.58%
Purchase Details
Closed on
Aug 5, 1999
Sold by
King Billy Glen
Bought by
King Debra K
Home Financials for this Owner
Home Financials are based on the most recent Mortgage that was taken out on this home.
Original Mortgage
$60,900
Interest Rate
7.58%
Create a Home Valuation Report for This Property
The Home Valuation Report is an in-depth analysis detailing your home's value as well as a comparison with similar homes in the area
Home Values in the Area
Average Home Value in this Area
Purchase History
| Date | Buyer | Sale Price | Title Company |
|---|---|---|---|
| Stripe Richard B | -- | None Available | |
| Stripe Richard B | -- | -- | |
| Stripe Richard B | -- | -- | |
| King Debra K | -- | -- |
Source: Public Records
Mortgage History
| Date | Status | Borrower | Loan Amount |
|---|---|---|---|
| Previous Owner | Stripe Richard B | $60,900 |
Source: Public Records
Tax History Compared to Growth
Tax History
| Year | Tax Paid | Tax Assessment Tax Assessment Total Assessment is a certain percentage of the fair market value that is determined by local assessors to be the total taxable value of land and additions on the property. | Land | Improvement |
|---|---|---|---|---|
| 2025 | $1,501 | $323,070 | $59,500 | $263,570 |
| 2024 | $1,501 | $323,070 | $59,500 | $263,570 |
| 2023 | $1,501 | $276,300 | $51,000 | $225,300 |
| 2022 | $7,009 | $276,300 | $51,000 | $225,300 |
| 2021 | $5,695 | $214,270 | $38,250 | $176,020 |
| 2020 | $4,652 | $164,980 | $38,250 | $126,730 |
| 2019 | $4,752 | $162,640 | $38,250 | $124,390 |
| 2018 | $4,443 | $152,070 | $38,250 | $113,820 |
| 2017 | $4,440 | $152,070 | $38,250 | $113,820 |
| 2016 | $3,805 | $130,320 | $38,250 | $92,070 |
| 2015 | $3,221 | $130,320 | $38,250 | $92,070 |
| 2014 | $3,221 | $130,320 | $38,250 | $92,070 |
Source: Public Records
Map
Nearby Homes
- 720 Burleson St
- 322 Hill St
- 529 NE 4th St
- 1005 Capetown Dr
- 1002 Capetown Dr
- 805 NW 9th St
- 710 Greenland Way
- 742 Austrian Rd
- 1109 Capetown Dr
- 320 Fairhavens Place
- 202 North St
- 1218 W Church St
- 729 Finland St
- 645 NW 10th St
- 2434 Starlight St
- 3682 Zenith Rd
- 729 Surrey Cir
- 1213 W Tarrant Rd
- 1202 W Strong Pkwy
- 505 N Carrier Pkwy
- 1006 Cook Dr
- 1014 Cook Dr
- 1018 Cook Dr
- 1009 Cook Dr
- 1005 Cook Dr
- 1013 Cook Dr
- 922 Cook Dr
- 502 Turner Blvd
- 1017 Cook Dr
- 918 Cook Dr
- 201 W Tarrant Rd
- 201 W Tarrant Rd
- 506 Turner Blvd
- 507 Saddle Hill Dr
- 913 Cook Dr
- 914 Cook Dr
- 510 Turner Blvd
- 517 Saddle Hill Dr
- 210 W Tarrant Rd Unit ID1258270P
- 210 W Tarrant Rd Unit ID1258257P