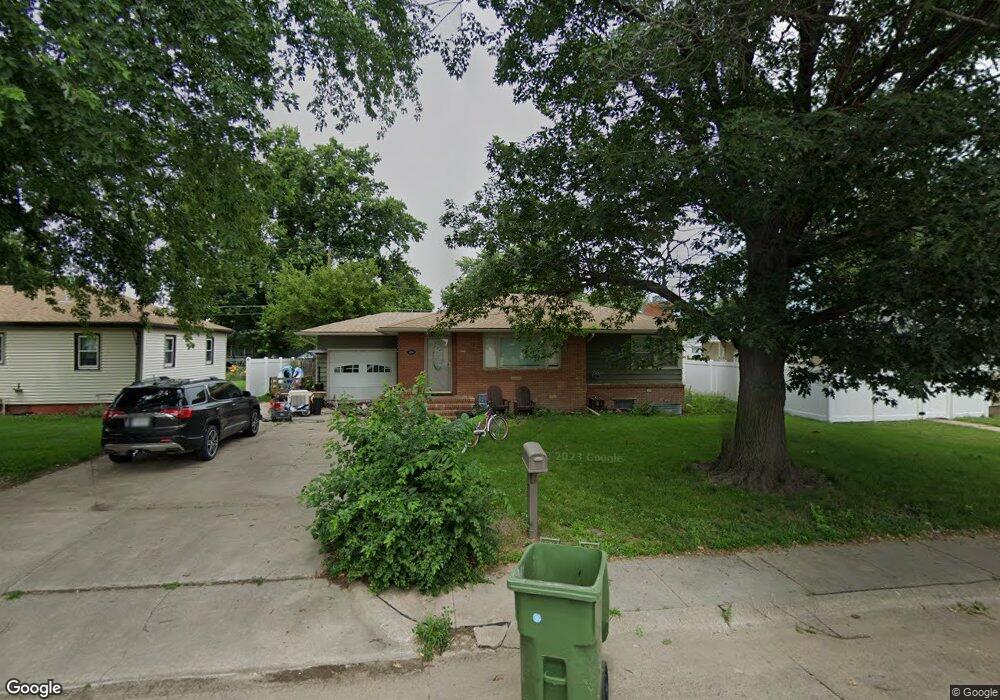
1010 E 30th St Kearney, NE 68847
Estimated Value: $228,000 - $255,000
4
Beds
2
Baths
1,144
Sq Ft
$213/Sq Ft
Est. Value
About This Home
This home is located at 1010 E 30th St, Kearney, NE 68847 and is currently estimated at $243,713, approximately $213 per square foot. 1010 E 30th St is a home located in Buffalo County with nearby schools including Emerson Elementary School, Sunrise Middle School, and Kearney Senior High School.
Ownership History
Date
Name
Owned For
Owner Type
Purchase Details
Closed on
Nov 18, 2022
Sold by
George Sean M
Bought by
Dickey Steven L
Current Estimated Value
Home Financials for this Owner
Home Financials are based on the most recent Mortgage that was taken out on this home.
Original Mortgage
$181,649
Outstanding Balance
$176,006
Interest Rate
6.94%
Mortgage Type
FHA
Estimated Equity
$67,707
Purchase Details
Closed on
Nov 20, 2009
Sold by
Huber Stuart and Huber Virginia
Bought by
George Sean M and George Lisa D
Home Financials for this Owner
Home Financials are based on the most recent Mortgage that was taken out on this home.
Original Mortgage
$128,627
Interest Rate
4.99%
Mortgage Type
FHA
Purchase Details
Closed on
Aug 31, 2009
Sold by
Huber Stuart and Huber Virginia
Bought by
Huber Stuart and Huber Virginia
Purchase Details
Closed on
Aug 11, 2009
Sold by
Huber Stuart and Huber Virginia
Bought by
Kolymago Calvin M and Kolymago Sharon K
Create a Home Valuation Report for This Property
The Home Valuation Report is an in-depth analysis detailing your home's value as well as a comparison with similar homes in the area
Home Values in the Area
Average Home Value in this Area
Purchase History
| Date | Buyer | Sale Price | Title Company |
|---|---|---|---|
| Dickey Steven L | $185,000 | Central Nebraska Title | |
| George Sean M | $131,000 | Barney | |
| Huber Stuart | -- | -- | |
| Kolymago Calvin M | $77,601 | -- |
Source: Public Records
Mortgage History
| Date | Status | Borrower | Loan Amount |
|---|---|---|---|
| Open | Dickey Steven L | $181,649 | |
| Previous Owner | George Sean M | $128,627 | |
| Closed | Dickey Steven L | $7,200 |
Source: Public Records
Tax History
| Year | Tax Paid | Tax Assessment Tax Assessment Total Assessment is a certain percentage of the fair market value that is determined by local assessors to be the total taxable value of land and additions on the property. | Land | Improvement |
|---|---|---|---|---|
| 2025 | $2,295 | $178,605 | $34,105 | $144,500 |
| 2024 | $3,066 | $187,060 | $33,110 | $153,950 |
| 2023 | $3,066 | $180,145 | $33,110 | $147,035 |
| 2022 | $2,916 | $166,170 | $32,570 | $133,600 |
| 2021 | $2,711 | $157,215 | $33,280 | $123,935 |
| 2020 | $2,775 | $160,430 | $34,795 | $125,635 |
| 2019 | $2,747 | $156,880 | $34,620 | $122,260 |
| 2018 | $2,587 | $149,865 | $31,110 | $118,755 |
| 2017 | $2,468 | $143,945 | $31,110 | $112,835 |
| 2016 | $2,448 | $143,945 | $31,110 | $112,835 |
| 2015 | $2,350 | $135,100 | $0 | $0 |
| 2014 | $2,160 | $113,270 | $0 | $0 |
Source: Public Records
Map
Nearby Homes
Your Personal Tour Guide
Ask me questions while you tour the home.