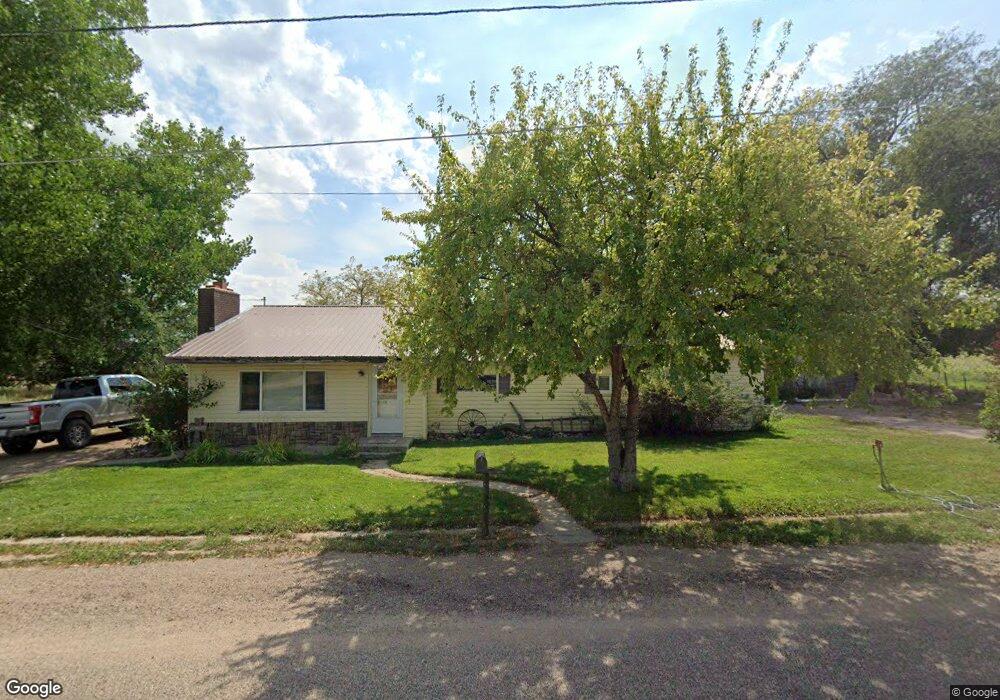
1010 E 4000 S Vernal, UT 84078
Estimated Value: $251,000 - $299,000
3
Beds
1
Bath
1,392
Sq Ft
$199/Sq Ft
Est. Value
About This Home
This home is located at 1010 E 4000 S, Vernal, UT 84078 and is currently estimated at $276,904, approximately $198 per square foot. 1010 E 4000 S is a home located in Uintah County with nearby schools including Davis School, Vernal Middle School, and Uintah Middle School.
Ownership History
Date
Name
Owned For
Owner Type
Purchase Details
Closed on
Dec 29, 2006
Sold by
Olsen Tyler J and Olsen Nicole Y
Bought by
Nelson Nancy L
Current Estimated Value
Home Financials for this Owner
Home Financials are based on the most recent Mortgage that was taken out on this home.
Original Mortgage
$91,500
Outstanding Balance
$54,528
Interest Rate
6.16%
Mortgage Type
New Conventional
Estimated Equity
$222,376
Purchase Details
Closed on
Feb 9, 2005
Sold by
Olsen Tyler J
Bought by
Olsen Tyler J and Olsen Nicole Y
Home Financials for this Owner
Home Financials are based on the most recent Mortgage that was taken out on this home.
Original Mortgage
$99,434
Interest Rate
5.81%
Mortgage Type
FHA
Create a Home Valuation Report for This Property
The Home Valuation Report is an in-depth analysis detailing your home's value as well as a comparison with similar homes in the area
Purchase History
| Date | Buyer | Sale Price | Title Company |
|---|---|---|---|
| Nelson Nancy L | -- | -- | |
| Olsen Tyler J | -- | -- |
Source: Public Records
Mortgage History
| Date | Status | Borrower | Loan Amount |
|---|---|---|---|
| Open | Nelson Nancy L | $91,500 | |
| Previous Owner | Olsen Tyler J | $99,434 |
Source: Public Records
Tax History
| Year | Tax Paid | Tax Assessment Tax Assessment Total Assessment is a certain percentage of the fair market value that is determined by local assessors to be the total taxable value of land and additions on the property. | Land | Improvement |
|---|---|---|---|---|
| 2024 | $967 | $111,100 | $19,721 | $91,379 |
| 2023 | $934 | $98,496 | $19,721 | $78,775 |
| 2022 | $854 | $82,741 | $19,721 | $63,020 |
| 2021 | $908 | $72,238 | $19,721 | $52,517 |
| 2020 | $879 | $71,814 | $19,250 | $52,564 |
| 2019 | $847 | $68,375 | $19,250 | $49,125 |
| 2018 | $817 | $66,036 | $19,250 | $46,786 |
| 2017 | $8 | $66,036 | $19,250 | $46,786 |
| 2016 | $821 | $72,842 | $19,250 | $53,592 |
| 2015 | $702 | $67,632 | $19,250 | $48,382 |
| 2014 | $694 | $67,632 | $19,250 | $48,382 |
| 2013 | $709 | $67,632 | $19,250 | $48,382 |
Source: Public Records
Map
Nearby Homes
Your Personal Tour Guide
Ask me questions while you tour the home.