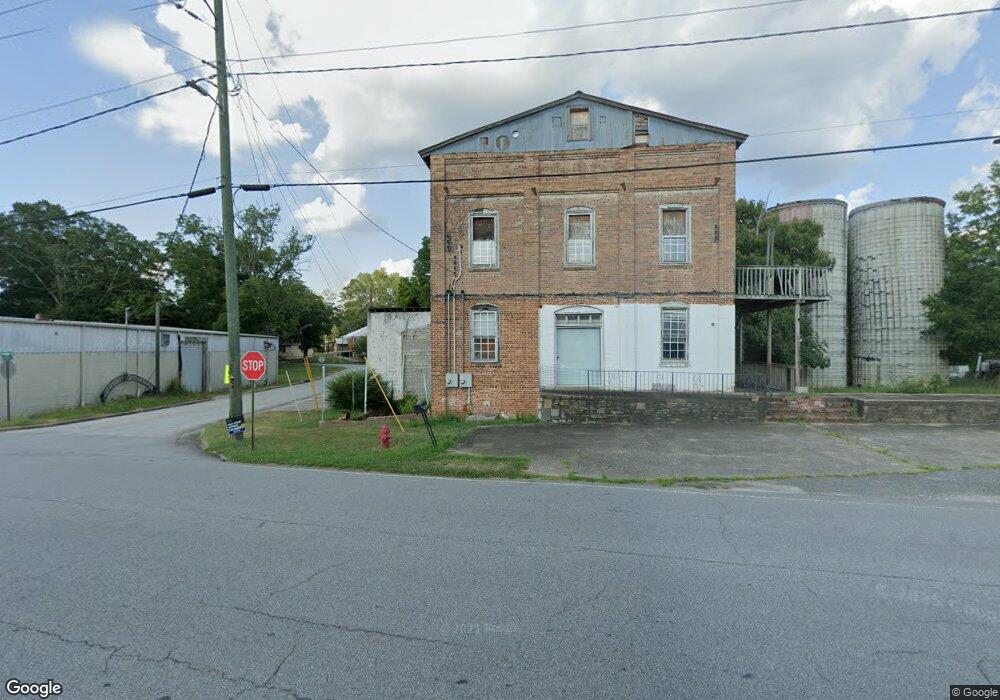
1010 E Main St Lavonia, GA 30553
Estimated Value: $134,044
1
Bed
1
Bath
5,000
Sq Ft
$27/Sq Ft
Est. Value
About This Home
This home is located at 1010 E Main St, Lavonia, GA 30553 and is currently estimated at $134,044, approximately $26 per square foot. 1010 E Main St is a home located in Franklin County with nearby schools including Franklin County High School.
Ownership History
Date
Name
Owned For
Owner Type
Purchase Details
Closed on
Sep 9, 2025
Sold by
Caswell Jerry Lee
Bought by
Morgan Courtney
Current Estimated Value
Purchase Details
Closed on
Jun 4, 2024
Sold by
Morgan Courtney
Bought by
Caswell Jerry Lee
Purchase Details
Closed on
Nov 22, 2022
Sold by
Frost James Andrew
Bought by
Morgan Courtney
Purchase Details
Closed on
Nov 20, 2020
Sold by
Horton William W
Bought by
Frost James Andrew and Frost Elizabeth Smith
Purchase Details
Closed on
Aug 7, 2006
Sold by
Maximum Property Svcs Inc
Bought by
Horton William W
Home Financials for this Owner
Home Financials are based on the most recent Mortgage that was taken out on this home.
Original Mortgage
$54,000
Interest Rate
6.71%
Mortgage Type
Commercial
Purchase Details
Closed on
Jun 15, 2001
Sold by
Nugen Samuel L
Bought by
Maximum Properties
Purchase Details
Closed on
Sep 18, 1993
Bought by
Nugen Samuel L
Create a Home Valuation Report for This Property
The Home Valuation Report is an in-depth analysis detailing your home's value as well as a comparison with similar homes in the area
Home Values in the Area
Average Home Value in this Area
Purchase History
| Date | Buyer | Sale Price | Title Company |
|---|---|---|---|
| Morgan Courtney | -- | -- | |
| Caswell Jerry Lee | $31,000 | -- | |
| Morgan Courtney | $117,000 | -- | |
| Frost James Andrew | $75,000 | -- | |
| Horton William W | $55,000 | -- | |
| Maximum Properties | $50,000 | -- | |
| Nugen Samuel L | $12,000 | -- |
Source: Public Records
Mortgage History
| Date | Status | Borrower | Loan Amount |
|---|---|---|---|
| Previous Owner | Horton William W | $54,000 |
Source: Public Records
Tax History Compared to Growth
Tax History
| Year | Tax Paid | Tax Assessment Tax Assessment Total Assessment is a certain percentage of the fair market value that is determined by local assessors to be the total taxable value of land and additions on the property. | Land | Improvement |
|---|---|---|---|---|
| 2024 | $1,526 | $46,068 | $14,592 | $31,476 |
| 2023 | $1,654 | $46,068 | $14,592 | $31,476 |
| 2022 | $1,101 | $30,664 | $11,674 | $18,990 |
| 2021 | $1,123 | $30,648 | $15,456 | $15,192 |
| 2020 | $929 | $24,463 | $15,456 | $9,007 |
| 2019 | $907 | $24,463 | $15,456 | $9,007 |
| 2018 | $0 | $24,463 | $15,456 | $9,007 |
| 2017 | $938 | $24,463 | $15,456 | $9,007 |
| 2016 | $1,114 | $27,622 | $18,692 | $8,930 |
| 2015 | -- | $27,621 | $18,692 | $8,930 |
| 2014 | -- | $27,622 | $18,692 | $8,930 |
| 2013 | -- | $27,621 | $18,691 | $8,930 |
Source: Public Records
Map
Nearby Homes
- 353 Bow Dr
- 0 Highway 59 Unit 10615036
- 5710 Vickery St
- 90 Old City Park Rd
- 86 Luckie St
- 5494 Vickery St
- 5474 Vickery St
- 266 Randall St
- 89 Huntington Dr
- 49 Wright St Unit 65
- 45 Wright St Unit 64
- 57 Wright St Unit 68
- 55 Wright St Unit 67
- 51 Wright St Unit 66
- 138 Victoria Ln
- 59 Wright St Unit 69
- 103 Ross Place
- 0 Hwy 59 and Ross Place Unit 10499138
- 4094 Lankford Rd
- 4025 Lankford Rd
- 1038 E Main St
- 1038 E Main St
- 5858 Vickery St
- 99 Hartwell Rd
- 5844 Vickery St
- 0 Jones St Unit TRACT 2 3270912
- 0 Jones St Unit TRACT 5 3271163
- 0 Jones St Unit 7185503
- 0 Jones St Unit 987843
- 0 Jones St Unit 987836
- 0 Jones St Unit 987797
- 0 Jones St Unit 20034423
- 0 Jones St Unit 7025595
- 0 Jones St Unit 3071430
- 0 Jones St Unit 7329853
- 0 Jones St Unit 7025603
- 0 Jones St Unit 2693295
- 0 Jones St Unit 3211002
- 0 Jones St Unit 3279158
- 0 Jones St Unit 8053330