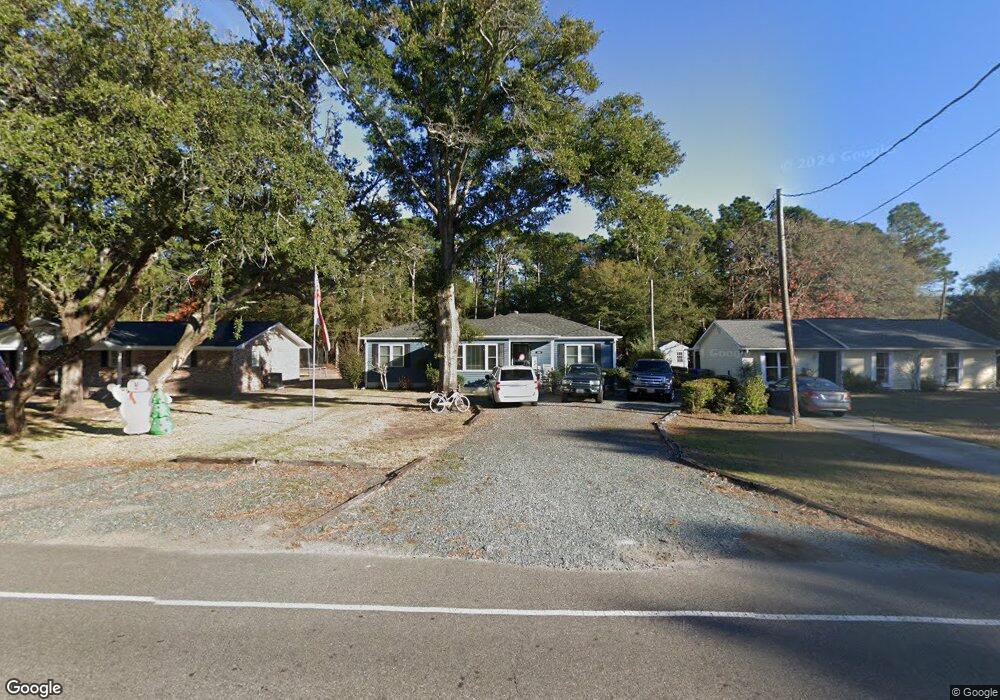
1010 E Moore St Southport, NC 28461
Estimated Value: $385,899 - $453,000
3
Beds
2
Baths
1,401
Sq Ft
$295/Sq Ft
Est. Value
About This Home
This home is located at 1010 E Moore St, Southport, NC 28461 and is currently estimated at $412,725, approximately $294 per square foot. 1010 E Moore St is a home located in Brunswick County with nearby schools including Southport Elementary School, South Brunswick Middle School, and South Brunswick High School.
Ownership History
Date
Name
Owned For
Owner Type
Purchase Details
Closed on
Apr 20, 2021
Sold by
Successive Properties Llc
Bought by
Hatcher Jamie J and Hatcher Lisa B
Current Estimated Value
Home Financials for this Owner
Home Financials are based on the most recent Mortgage that was taken out on this home.
Original Mortgage
$209,600
Outstanding Balance
$189,243
Interest Rate
3%
Mortgage Type
New Conventional
Estimated Equity
$223,482
Purchase Details
Closed on
Mar 18, 2009
Sold by
Accredited Reo Properties Llc
Bought by
Successive Properties Llc
Purchase Details
Closed on
Jul 30, 2007
Sold by
Rogers Bonnie Simmons and Rice William
Bought by
Kruse Jeff D
Home Financials for this Owner
Home Financials are based on the most recent Mortgage that was taken out on this home.
Original Mortgage
$148,000
Interest Rate
8.75%
Mortgage Type
Adjustable Rate Mortgage/ARM
Create a Home Valuation Report for This Property
The Home Valuation Report is an in-depth analysis detailing your home's value as well as a comparison with similar homes in the area
Home Values in the Area
Average Home Value in this Area
Purchase History
| Date | Buyer | Sale Price | Title Company |
|---|---|---|---|
| Hatcher Jamie J | $262,000 | None Available | |
| Successive Properties Llc | $95,000 | None Available | |
| Kruse Jeff D | $185,000 | None Available |
Source: Public Records
Mortgage History
| Date | Status | Borrower | Loan Amount |
|---|---|---|---|
| Open | Hatcher Jamie J | $209,600 | |
| Previous Owner | Kruse Jeff D | $148,000 |
Source: Public Records
Tax History
| Year | Tax Paid | Tax Assessment Tax Assessment Total Assessment is a certain percentage of the fair market value that is determined by local assessors to be the total taxable value of land and additions on the property. | Land | Improvement |
|---|---|---|---|---|
| 2025 | $2,552 | $339,890 | $115,000 | $224,890 |
| 2024 | $24 | $339,890 | $115,000 | $224,890 |
| 2023 | $1,863 | $339,890 | $115,000 | $224,890 |
| 2022 | $1,863 | $180,610 | $75,000 | $105,610 |
| 2021 | $1,605 | $173,970 | $75,000 | $98,970 |
| 2020 | $1,605 | $173,970 | $75,000 | $98,970 |
| 2019 | $1,605 | $76,810 | $75,000 | $1,810 |
| 2018 | $1,428 | $66,810 | $65,000 | $1,810 |
| 2017 | $1,416 | $66,810 | $65,000 | $1,810 |
| 2016 | $1,312 | $66,810 | $65,000 | $1,810 |
| 2015 | $1,279 | $153,010 | $65,000 | $88,010 |
| 2014 | $1,428 | $182,330 | $100,000 | $82,330 |
Source: Public Records
Map
Nearby Homes
- 1012 E Moore St
- 1010 Softwind Way
- 1014 Softwind Way
- 226 Sand Dollar Ln
- 263 Sand Dollar Ln
- 263 Sand Dollar Ln Unit 27
- 271 Sand Dollar Ln Unit 26
- 271 Sand Dollar Ln
- 278 Sand Dollar Ln Unit 37
- 717 E Moore St
- 258 Sand Dollar Ln
- 103 Herring Dr
- 2071 Rosin Dr
- 2071 Rosin Dr Unit 19
- 304 River Dr
- 704 E Moore St Unit 110
- 2075 Rosin Dr Unit 18
- 2067 Rosin Dr
- 2067 Rosin Dr Unit 20
- 702 E Moore St Unit 207
- 1010 E Moore St
- 1008 E Moore St
- 1012 E Moore St Unit E
- 1006 E Moore St
- 1004 E Moore St
- 1007 E Moore St
- 1009 E Moore St
- 1005 E Moore St
- 105 Cape Fear Dr
- 1011 E Moore St
- 1002 E Moore St
- 1034 Sea Horse Ct
- 1034 Sea Horse Ct
- 1034 Sea Horse Ct Unit Lot 5
- 107 Cape Fear Dr
- 1038 Sea Horse Ct Unit Lot 6
- 1038 Sea Horse Ct
- 1030 Sea Horse Ct
- 200 Sand Dollar Ln
- 201 Sand Dollar Ln Unit Lot 13
Your Personal Tour Guide
Ask me questions while you tour the home.