Estimated Value: $495,403 - $525,000
3
Beds
3
Baths
1,597
Sq Ft
$319/Sq Ft
Est. Value
About This Home
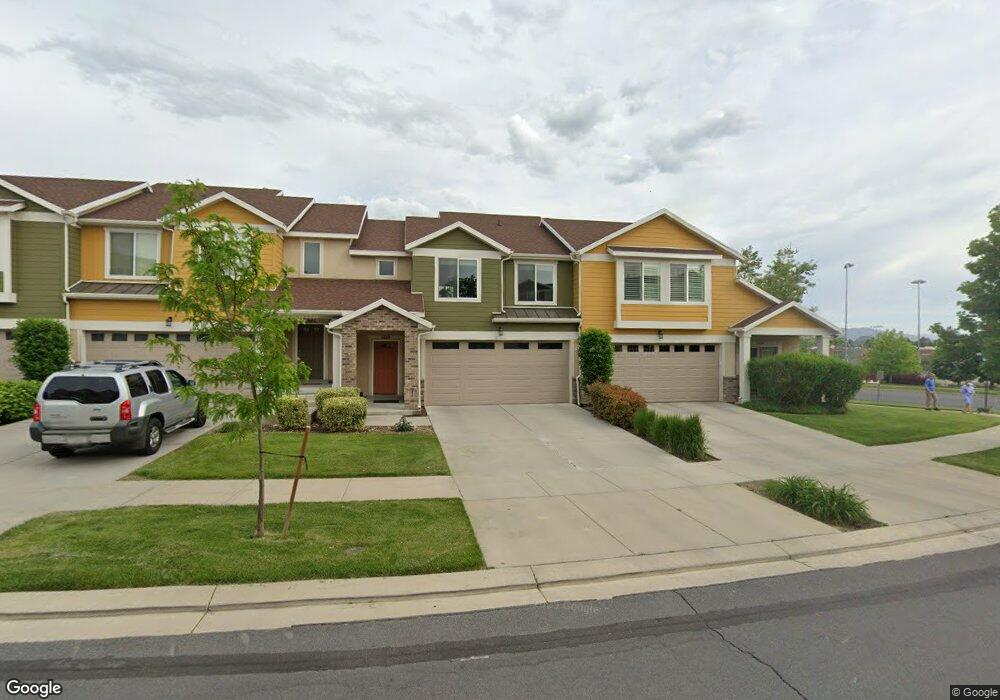
This home is located at 1010 E Quarry View Way, Sandy, UT 84094 and is currently estimated at $509,101, approximately $318 per square foot. 1010 E Quarry View Way is a home located in Salt Lake County with nearby schools including Union Middle School, Hillcrest High School, and The Waterford School.
Ownership History
Date
Name
Owned For
Owner Type
Purchase Details
Closed on
Jul 11, 2022
Sold by
Justin Anthony Robert
Bought by
Mcnutt Jeffrey
Current Estimated Value
Purchase Details
Closed on
May 25, 2018
Sold by
Irrevoc Allebest Edward F
Bought by
Anthony Robert Justin
Home Financials for this Owner
Home Financials are based on the most recent Mortgage that was taken out on this home.
Original Mortgage
$233,600
Interest Rate
4.5%
Mortgage Type
New Conventional
Purchase Details
Closed on
Dec 15, 2016
Sold by
Kearns Sharon and Kearns Jason
Bought by
Allebest Edward F and The Jerry & Jacqueline Doyle Irrevocable
Purchase Details
Closed on
Aug 8, 2007
Sold by
Pebblebrook Development Corp
Bought by
Kearns Sharon and Kearns Jason
Home Financials for this Owner
Home Financials are based on the most recent Mortgage that was taken out on this home.
Original Mortgage
$187,400
Interest Rate
6.65%
Mortgage Type
Purchase Money Mortgage
Create a Home Valuation Report for This Property
The Home Valuation Report is an in-depth analysis detailing your home's value as well as a comparison with similar homes in the area
Home Values in the Area
Average Home Value in this Area
Purchase History
| Date | Buyer | Sale Price | Title Company |
|---|---|---|---|
| Mcnutt Jeffrey | -- | Real Advantage Title Insurance | |
| Anthony Robert Justin | -- | Backman Title Services | |
| Allebest Edward F | -- | Meridian Title | |
| Kearns Sharon | -- | Meridian Title |
Source: Public Records
Mortgage History
| Date | Status | Borrower | Loan Amount |
|---|---|---|---|
| Previous Owner | Anthony Robert Justin | $233,600 | |
| Previous Owner | Kearns Sharon | $187,400 |
Source: Public Records
Tax History
| Year | Tax Paid | Tax Assessment Tax Assessment Total Assessment is a certain percentage of the fair market value that is determined by local assessors to be the total taxable value of land and additions on the property. | Land | Improvement |
|---|---|---|---|---|
| 2025 | $2,487 | $472,400 | $54,100 | $418,300 |
| 2024 | $2,487 | $459,900 | $50,700 | $409,200 |
| 2023 | $2,416 | $445,500 | $48,200 | $397,300 |
| 2022 | $2,590 | $466,500 | $47,300 | $419,200 |
| 2021 | $2,222 | $340,700 | $39,600 | $301,100 |
| 2020 | $2,150 | $310,900 | $39,600 | $271,300 |
| 2019 | $2,140 | $301,500 | $37,300 | $264,200 |
| 2016 | $2,018 | $273,400 | $88,400 | $185,000 |
Source: Public Records
Map
Nearby Homes
- 8971 Valley Bend Ct
- 8935 Quarry Stone Way
- 1138 E Quarry Stone Way
- 876 E Chariot Dr
- 9092 Enchanted Oak Ln
- 807 E Whisper Cove Rd
- 9218 S Laura Anne Way
- 8732 S Oakwood Park Cr
- 8797 Green Way Unit 3
- 8722 S Oakwood Park Cir
- 8569 Round Stone Cove
- 8569 Round Stone Cove Unit 8
- 1242 Earl Way
- 8729 S Leafwood Ln
- 8492 Fayeway Dr
- 8450 S 865 E
- 8546 S 1330 E
- 8732 S 620 E
- 1430 E 8685 S
- 8857 S Capella Way
- 1010 Quarry View Way
- 1012 Quarry View Way
- 1012 E Quarry View Way
- 1006 Quarry View Way
- 1014 Quarry View Way
- 1019 E Quarry Park Dr
- 1019 Quarry Park Dr
- 1015 Quarry Park Dr
- 1023 Quarry Park Dr
- 1023 E Quarry Park Dr
- 1020 Quarry View Way
- 1027 Quarry View Way
- 1027 E Quarry Park Dr
- 1005 Quarry View Way
- 1007 E Quarry View Way
- 1007 Quarry View Way
- 1003 Quarry View Way
- 1009 Quarry View Way
- 1024 Quarry View Way
- 1001 E Quarry View Way
Your Personal Tour Guide
Ask me questions while you tour the home.