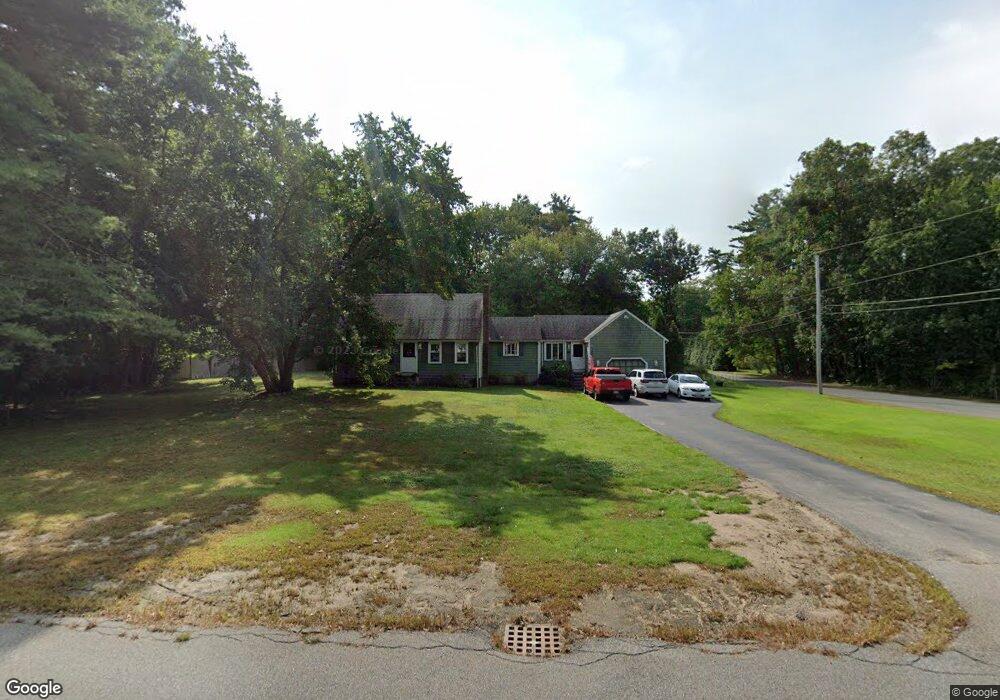
1010 E Washington St Hanson, MA 02341
Estimated Value: $598,461 - $698,000
4
Beds
2
Baths
1,856
Sq Ft
$356/Sq Ft
Est. Value
About This Home
This home is located at 1010 E Washington St, Hanson, MA 02341 and is currently estimated at $660,865, approximately $356 per square foot. 1010 E Washington St is a home located in Plymouth County with nearby schools including Cardinal Cushing Centers.
Ownership History
Date
Name
Owned For
Owner Type
Purchase Details
Closed on
Oct 12, 2011
Sold by
Velez Carlos A and Velez Johanna
Bought by
Gramazio Richard A
Current Estimated Value
Home Financials for this Owner
Home Financials are based on the most recent Mortgage that was taken out on this home.
Original Mortgage
$277,775
Outstanding Balance
$190,818
Interest Rate
4.25%
Mortgage Type
Purchase Money Mortgage
Estimated Equity
$470,047
Purchase Details
Closed on
Jan 10, 2011
Sold by
Gilleo Jeanette M
Bought by
Velez Carlos A and Velez Johanna
Purchase Details
Closed on
Oct 16, 2007
Sold by
Velez Carlos A and Velez Johanna
Bought by
Gilleo Jeanette M
Purchase Details
Closed on
Sep 16, 2005
Sold by
Regan Michael J and Regan Clara
Bought by
Velez Carlos A and Velez Johanna
Home Financials for this Owner
Home Financials are based on the most recent Mortgage that was taken out on this home.
Original Mortgage
$359,650
Interest Rate
5.84%
Mortgage Type
Purchase Money Mortgage
Create a Home Valuation Report for This Property
The Home Valuation Report is an in-depth analysis detailing your home's value as well as a comparison with similar homes in the area
Home Values in the Area
Average Home Value in this Area
Purchase History
| Date | Buyer | Sale Price | Title Company |
|---|---|---|---|
| Gramazio Richard A | $285,000 | -- | |
| Velez Carlos A | $15,000 | -- | |
| Gilleo Jeanette M | -- | -- | |
| Velez Carlos A | $385,000 | -- |
Source: Public Records
Mortgage History
| Date | Status | Borrower | Loan Amount |
|---|---|---|---|
| Open | Gramazio Richard A | $277,775 | |
| Previous Owner | Velez Carlos A | $359,650 | |
| Previous Owner | Velez Carlos A | $225,000 |
Source: Public Records
Tax History
| Year | Tax Paid | Tax Assessment Tax Assessment Total Assessment is a certain percentage of the fair market value that is determined by local assessors to be the total taxable value of land and additions on the property. | Land | Improvement |
|---|---|---|---|---|
| 2025 | $6,254 | $467,400 | $172,100 | $295,300 |
| 2024 | $5,945 | $444,300 | $167,100 | $277,200 |
| 2023 | $5,851 | $412,600 | $167,100 | $245,500 |
| 2022 | $5,719 | $379,000 | $151,900 | $227,100 |
| 2021 | $5,105 | $338,100 | $146,100 | $192,000 |
| 2020 | $5,036 | $329,800 | $141,100 | $188,700 |
| 2019 | $4,859 | $312,900 | $138,400 | $174,500 |
| 2018 | $4,765 | $301,000 | $133,100 | $167,900 |
| 2017 | $4,623 | $289,300 | $126,800 | $162,500 |
| 2016 | $4,713 | $284,800 | $126,800 | $158,000 |
| 2015 | $4,438 | $278,800 | $126,800 | $152,000 |
Source: Public Records
Map
Nearby Homes
- 339 State St
- 430 Brook Bend Rd
- 108 Waterford Dr
- 139 Fairwood Dr
- 114 Graham Hill Dr
- 51 Farmside Dr
- 26 Stonebridge Dr
- 95 Tecumseh Dr
- 7 Farmside Dr
- 51 Cervelli Farm Dr
- 37 Dr
- 23 Cervelli Farm Dr
- 38 Cervelli Farm Dr
- 9 Cervelli Farm Dr
- 285 W Elm St
- 250 Center St
- 127 Crescent Place
- 35 Sproul Rd
- 161 Winter St Unit 11
- 269 Lakeside Rd
- 1022 E Washington St
- 33 Old Pine Dr
- 988 E Washington St
- 988 E Washington St Unit 1
- 1007 E Washington St
- 28 Old Pine Dr
- 991 E Washington St
- 1034 E Washington St
- 1031 E Washington St
- 974 E Washington St
- 52 Old Pine Dr
- 1043 E Washington St
- 27 Carriage Rd
- 1048 E Washington St
- 30 Carriage Rd
- 19 Surrey Ln
- 43 Old Pine Dr
- 963 E Washington St
- 958 E Washington St
- 1053 E Washington St
Your Personal Tour Guide
Ask me questions while you tour the home.