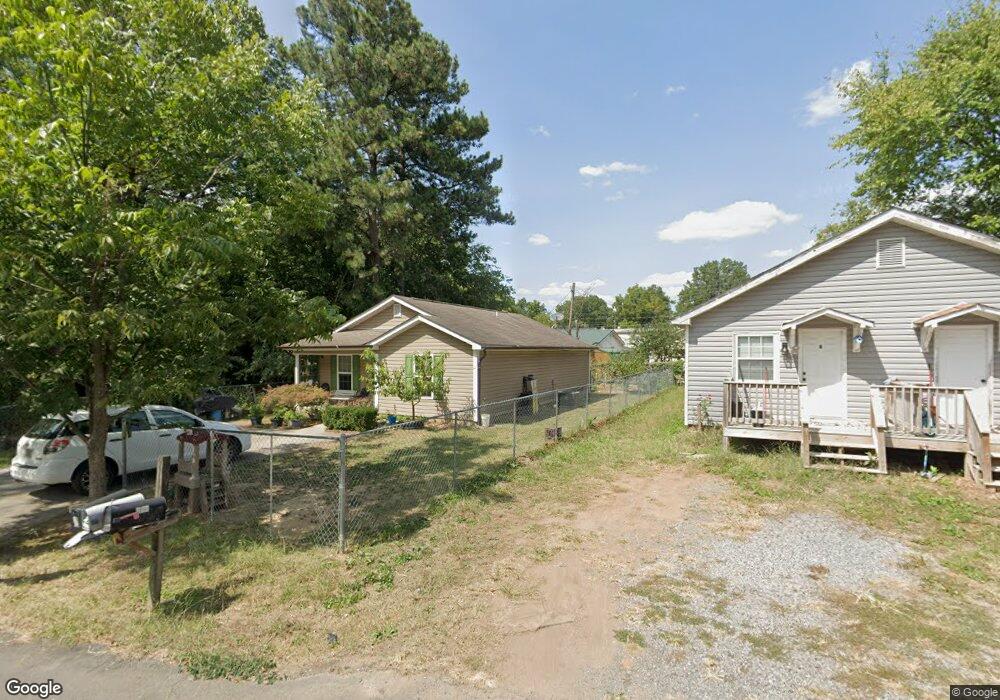
1010 Fielding St Dalton, GA 30721
Estimated Value: $163,320 - $235,000
3
Beds
3
Baths
1,672
Sq Ft
$117/Sq Ft
Est. Value
About This Home
This home is located at 1010 Fielding St, Dalton, GA 30721 and is currently estimated at $195,830, approximately $117 per square foot. 1010 Fielding St is a home located in Whitfield County with nearby schools including Blue Ridge Elementary School, Dalton Middle School, and Dalton High School.
Ownership History
Date
Name
Owned For
Owner Type
Purchase Details
Closed on
Jul 27, 2018
Sold by
G N M Property Rentals Llc
Bought by
Sarp Properties Llc
Current Estimated Value
Home Financials for this Owner
Home Financials are based on the most recent Mortgage that was taken out on this home.
Original Mortgage
$72,919
Interest Rate
4.5%
Mortgage Type
Mortgage Modification
Purchase Details
Closed on
Mar 9, 2012
Sold by
Hefner Michael Dwayne
Purchase Details
Closed on
Aug 5, 2010
Sold by
Federal Home Loan Mortgage Corporation
Bought by
Hefner Michael
Purchase Details
Closed on
Dec 20, 2005
Sold by
Ramirez Jorge L
Bought by
Valez Eliana B
Home Financials for this Owner
Home Financials are based on the most recent Mortgage that was taken out on this home.
Original Mortgage
$128,000
Interest Rate
6.19%
Mortgage Type
New Conventional
Purchase Details
Closed on
Mar 1, 1998
Bought by
Ramirez Jorge and Ramirez Elda
Create a Home Valuation Report for This Property
The Home Valuation Report is an in-depth analysis detailing your home's value as well as a comparison with similar homes in the area
Home Values in the Area
Average Home Value in this Area
Purchase History
| Date | Buyer | Sale Price | Title Company |
|---|---|---|---|
| Sarp Properties Llc | $85,000 | -- | |
| -- | $55,000 | -- | |
| -- | $55,000 | -- | |
| Hefner Michael | $55,000 | -- | |
| Valez Eliana B | $160,000 | -- | |
| Ramirez Jorge | $5,500 | -- |
Source: Public Records
Mortgage History
| Date | Status | Borrower | Loan Amount |
|---|---|---|---|
| Closed | Sarp Properties Llc | $72,919 | |
| Previous Owner | Valez Eliana B | $128,000 | |
| Previous Owner | Valez Eliana B | $24,000 |
Source: Public Records
Tax History Compared to Growth
Tax History
| Year | Tax Paid | Tax Assessment Tax Assessment Total Assessment is a certain percentage of the fair market value that is determined by local assessors to be the total taxable value of land and additions on the property. | Land | Improvement |
|---|---|---|---|---|
| 2024 | $2,092 | $87,318 | $6,720 | $80,598 |
| 2023 | $2,092 | $57,973 | $11,760 | $46,213 |
| 2022 | $1,437 | $41,716 | $11,760 | $29,956 |
| 2021 | $1,439 | $41,716 | $11,760 | $29,956 |
| 2020 | $1,513 | $42,228 | $12,272 | $29,956 |
| 2019 | $1,256 | $42,228 | $12,272 | $29,956 |
| 2018 | $1,584 | $42,228 | $12,272 | $29,956 |
| 2017 | $1,728 | $42,228 | $12,272 | $29,956 |
| 2016 | $1,293 | $35,594 | $6,006 | $29,588 |
| 2014 | $1,175 | $35,594 | $6,006 | $29,588 |
| 2013 | -- | $35,594 | $6,006 | $29,588 |
Source: Public Records
Map
Nearby Homes
- 902 Mattie Dr
- Lot 5 River Bend Rd
- Lot 4 Riverbend Rd
- Lot 7 Riverbend Rd
- 514 Sheridan Ave
- 432 4th Ave
- 303 Janice St
- 1118 Dozier St
- 1007 Locke Dr
- 503 Harris St
- 1302 Jackson Rd
- 0 Robinwood Dr
- 711 E Morris St
- 430 Lester Ave
- trac 2 Roosevelt Dr
- trac 3 Roosevelt Dr
- 204 N Bogle St
- 1412 Stevenson Dr
- 519 Abigail St
- 429 S Glenwood Ave
- 776 Fielding St
- 736 Fielding St
- 726 Fielding St
- 48, 49 Fielding St Unit 48, 49
- 0 Fielding St
- LOTS Fielding St
- 16 Fielding St
- 1007 Fielding St
- 788 Fielding St
- 770 Fielding St
- 1014 Richards St
- 785 Fielding St
- 783 Fielding St
- 1016 Richards St
- 1012 Richards St
- 804 Fielding St
- 798 Fielding St
- 777 Fielding St
- 1010 Richards St
- 1008 Richards St