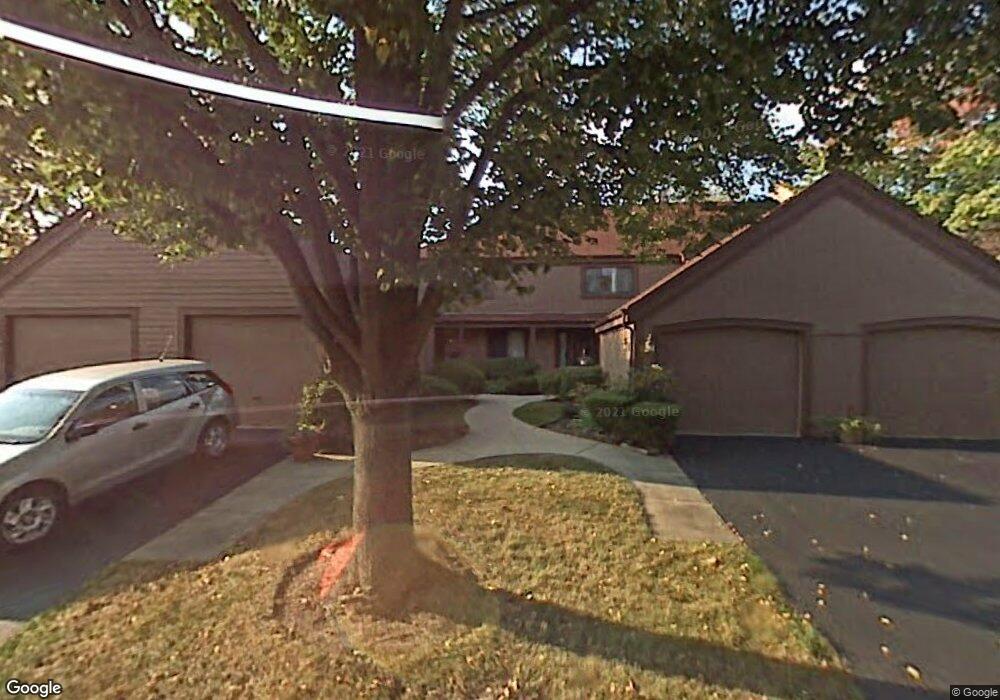
1010 Fremont Ct E Unit H8 Buffalo Grove, IL 60089
Estimated Value: $265,384 - $339,000
2
Beds
1
Bath
1,116
Sq Ft
$266/Sq Ft
Est. Value
About This Home
This home is located at 1010 Fremont Ct E Unit H8, Buffalo Grove, IL 60089 and is currently estimated at $297,346, approximately $266 per square foot. 1010 Fremont Ct E Unit H8 is a home located in Lake County with nearby schools including Kildeer Countryside Elementary School, Woodlawn Middle School, and Adlai E Stevenson High School.
Ownership History
Date
Name
Owned For
Owner Type
Purchase Details
Closed on
Dec 15, 2006
Sold by
Hoffman Joel
Bought by
Siwek Lisa D
Current Estimated Value
Purchase Details
Closed on
Apr 17, 2003
Sold by
Lopez Martin H
Bought by
Hoffman Joel
Home Financials for this Owner
Home Financials are based on the most recent Mortgage that was taken out on this home.
Original Mortgage
$128,000
Interest Rate
5.87%
Mortgage Type
Purchase Money Mortgage
Purchase Details
Closed on
Oct 21, 1993
Sold by
Kernaghan Carmel C
Bought by
Lopez Martin H
Home Financials for this Owner
Home Financials are based on the most recent Mortgage that was taken out on this home.
Original Mortgage
$87,250
Interest Rate
6.95%
Mortgage Type
Purchase Money Mortgage
Create a Home Valuation Report for This Property
The Home Valuation Report is an in-depth analysis detailing your home's value as well as a comparison with similar homes in the area
Home Values in the Area
Average Home Value in this Area
Purchase History
| Date | Buyer | Sale Price | Title Company |
|---|---|---|---|
| Siwek Lisa D | $204,000 | Ticor | |
| Hoffman Joel | $160,000 | Multiple | |
| Lopez Martin H | $68,333 | Attip Natl Title |
Source: Public Records
Mortgage History
| Date | Status | Borrower | Loan Amount |
|---|---|---|---|
| Previous Owner | Hoffman Joel | $128,000 | |
| Previous Owner | Lopez Martin H | $87,250 |
Source: Public Records
Tax History Compared to Growth
Tax History
| Year | Tax Paid | Tax Assessment Tax Assessment Total Assessment is a certain percentage of the fair market value that is determined by local assessors to be the total taxable value of land and additions on the property. | Land | Improvement |
|---|---|---|---|---|
| 2024 | $5,480 | $65,093 | $24,156 | $40,937 |
| 2023 | $5,568 | $61,420 | $22,793 | $38,627 |
| 2022 | $5,568 | $59,399 | $22,043 | $37,356 |
| 2021 | $5,353 | $58,758 | $21,805 | $36,953 |
| 2020 | $5,228 | $58,958 | $21,879 | $37,079 |
| 2019 | $5,159 | $58,740 | $21,798 | $36,942 |
| 2018 | $4,222 | $50,615 | $23,694 | $26,921 |
| 2017 | $4,169 | $49,434 | $23,141 | $26,293 |
| 2016 | $4,014 | $47,337 | $22,159 | $25,178 |
| 2015 | $3,882 | $44,269 | $20,723 | $23,546 |
| 2014 | $4,085 | $45,683 | $22,256 | $23,427 |
| 2012 | $4,043 | $45,775 | $22,301 | $23,474 |
Source: Public Records
Map
Nearby Homes
- 1324 Fairfax Ln Unit B32
- 1325 Fairfax Ln
- 1357 Bristol Ln Unit Q4
- 5107 N Arlington Heights Rd
- 12 Cloverdale Ct
- 887 Saybrook Ln Unit 2
- 1032 Courtland Dr Unit 9
- 950 Belmar Ln
- 1514 Sumter Dr
- 800 Clohesey Dr
- 890 Knollwood Dr
- 1141 Devonshire Rd
- 1265 Devonshire Rd
- 1545 Chickamauga Ln
- 931 Shady Grove Ln
- 1242 Antietam Dr
- 327 Lasalle Ln
- 1728 Holly Ct
- 610 Checker Dr
- 614 Lyon Ct
- 1012 Fremont Ct E Unit H7
- 1012 Fremont Ct E Unit 1012
- 1014 Fremont Ct E Unit H6
- 1016 Fremont Ct E Unit H5
- 1018 Fremont Ct E Unit H4
- 1020 Fremont Ct E Unit H3
- 1209 Franklin Ln Unit G7
- 1213 Franklin Ln Unit G6
- 1205 Franklin Ln Unit G8
- 1217 Franklin Ln Unit G5
- 1221 Franklin Ln Unit G4
- 1225 Franklin Ln Unit G3
- 1229 Franklin Ln Unit G2
- 1233 Franklin Ln Unit G1
- 1022 Fremont Ct E Unit H2
- 1024 Fremont Ct E Unit H1
- 1008 Fremont Ct E Unit I1
- 1008 Fremont Ct E Unit 1008
- 1006 Fremont Ct E Unit I2
- 1004 Fremont Ct E Unit I3