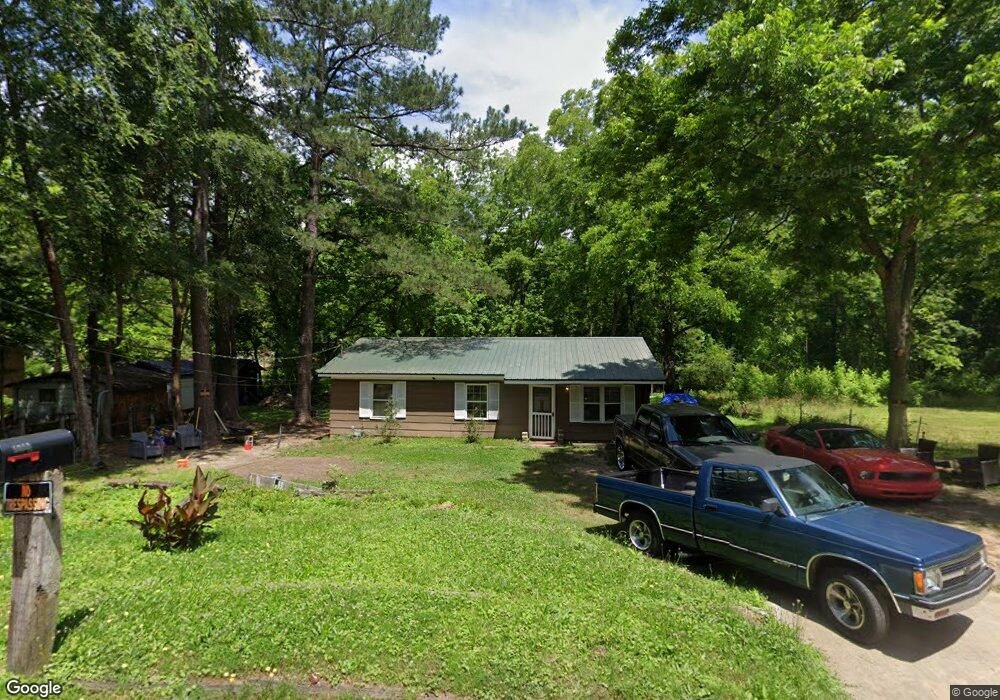
1010 Hurt St Union Point, GA 30669
Estimated Value: $86,187 - $169,000
2
Beds
1
Bath
1,040
Sq Ft
$127/Sq Ft
Est. Value
About This Home
This home is located at 1010 Hurt St, Union Point, GA 30669 and is currently estimated at $132,297, approximately $127 per square foot. 1010 Hurt St is a home located in Greene County with nearby schools including Greene County High School.
Ownership History
Date
Name
Owned For
Owner Type
Purchase Details
Closed on
Feb 7, 2024
Sold by
Griffin Mary L
Bought by
Griffin Jared
Current Estimated Value
Purchase Details
Closed on
Sep 11, 2015
Sold by
Morris Gary
Bought by
Griffin Mary L
Purchase Details
Closed on
Aug 5, 2014
Sold by
Griffin Mary L
Bought by
Morris Debra and Morris Gary
Purchase Details
Closed on
Jan 1, 1985
Sold by
Farmers Home Adm
Bought by
Griffin Mary L
Purchase Details
Closed on
Jan 1, 1984
Sold by
Dunn Grady Lee
Bought by
Farmers Home Adm
Purchase Details
Closed on
Jan 1, 1974
Sold by
Wilson William Ralph
Bought by
Dunn Grady Lee
Purchase Details
Closed on
Jan 1, 1973
Sold by
Durham Mercer C
Bought by
Wilson William Ralph
Purchase Details
Closed on
Jan 1, 1972
Sold by
Bryan Bryan F and Bryan Mrs
Bought by
Durham Mercer C
Purchase Details
Closed on
Jan 1, 1960
Sold by
Willingham Sylvester
Bought by
Bryan Bryan F and Bryan Mrs
Purchase Details
Closed on
Jan 1, 1959
Bought by
Willingham Sylvester
Create a Home Valuation Report for This Property
The Home Valuation Report is an in-depth analysis detailing your home's value as well as a comparison with similar homes in the area
Home Values in the Area
Average Home Value in this Area
Purchase History
| Date | Buyer | Sale Price | Title Company |
|---|---|---|---|
| Griffin Jared | -- | -- | |
| Griffin Mary L | $1,412 | -- | |
| Morris Debra | -- | -- | |
| Griffin Mary L | -- | -- | |
| Farmers Home Adm | -- | -- | |
| Dunn Grady Lee | -- | -- | |
| Wilson William Ralph | -- | -- | |
| Durham Mercer C | -- | -- | |
| Bryan Bryan F | -- | -- | |
| Willingham Sylvester | -- | -- |
Source: Public Records
Tax History Compared to Growth
Tax History
| Year | Tax Paid | Tax Assessment Tax Assessment Total Assessment is a certain percentage of the fair market value that is determined by local assessors to be the total taxable value of land and additions on the property. | Land | Improvement |
|---|---|---|---|---|
| 2024 | $565 | $14,480 | $2,440 | $12,040 |
| 2023 | $451 | $13,920 | $2,440 | $11,480 |
| 2022 | $398 | $12,880 | $2,440 | $10,440 |
| 2021 | $382 | $11,640 | $2,440 | $9,200 |
| 2020 | $286 | $5,960 | $1,320 | $4,640 |
| 2019 | $290 | $5,960 | $1,320 | $4,640 |
| 2018 | $152 | $5,960 | $1,320 | $4,640 |
| 2017 | $258 | $5,996 | $1,350 | $4,646 |
| 2016 | $264 | $6,156 | $1,350 | $4,806 |
| 2015 | $122 | $6,156 | $1,350 | $4,806 |
| 2014 | $244 | $6,442 | $1,350 | $5,092 |
Source: Public Records
Map
Nearby Homes
- 324 N Rhodes St
- 215 Hunter St
- 0 Woodland Ct Unit 10543600
- 202 Veazey St
- 0 S Rhodes St Unit 10618488
- 112 Hendry St
- 0 Washington Hwy Unit 7276060
- 1860 Washington Hwy
- 1041 Hillcrest Dr
- 1241 Old Siloam Rd
- 5401 Union Point Hwy
- 1581 Highway 77 S Hwy
- 1201 Buffalo Lick Rd
- 0 Buffalo Lick Rd Unit 10551234
- 0 Buffalo Lick Rd Unit 10551325
- 1581 Highway 77 S
- 1251 Adams Rd
- 0 Old Union Point Rd Unit 1 10557753
- 1251 Brick House Rd
- 1251 Brickhouse Rd
- 1020 Hurt St
- 901 Crawfordville Rd
- 902 Crawfordville Rd
- 909 Crawfordville Rd
- 408 Barnes St
- 910 Crawfordville Rd
- 1030 Hurt St Unit 1151 & 1161 Old Silo
- 1030 Hurt St
- 911 Crawfordville Rd
- 108 Hurt St
- 1018 Hurt St
- 406 Barnes St
- 912 Crawfordville Rd
- 821 Park Ave
- 804 Crawfordville Rd
- 404 Barnes St
- 1040 Hurt St
- 914 Crawfordville Rd
- 809 Park Ave
- 913 Crawfordville Rd