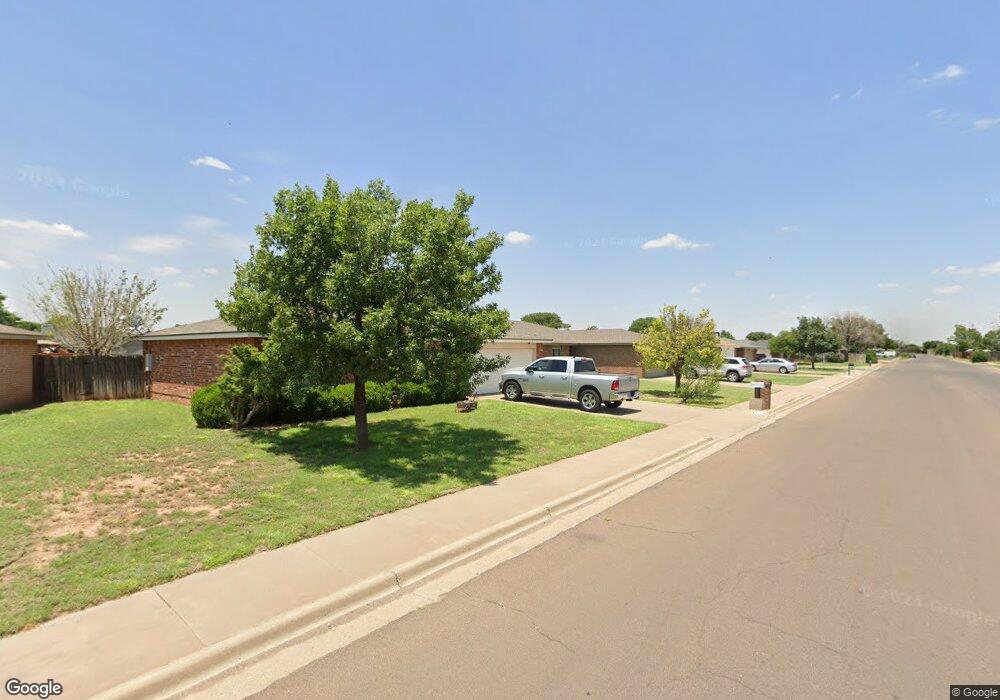
1010 Iola Dr Lubbock, TX 79416
Northridge NeighborhoodEstimated Value: $193,000 - $206,383
3
Beds
2
Baths
1,676
Sq Ft
$121/Sq Ft
Est. Value
About This Home
This home is located at 1010 Iola Dr, Lubbock, TX 79416 and is currently estimated at $202,346, approximately $120 per square foot. 1010 Iola Dr is a home located in Lubbock County with nearby schools including North Ridge Elementary School, Terra Vista Middle School, and Frenship High School.
Ownership History
Date
Name
Owned For
Owner Type
Purchase Details
Closed on
Dec 9, 2022
Sold by
Sharp Gary and Sharp Cindy
Bought by
Sharp Macy Lyn
Current Estimated Value
Purchase Details
Closed on
Mar 1, 2019
Sold by
Higgins Dwight and Higgins Jo Ann
Bought by
Sharp Cindy Odell and Sharp Gary Don
Home Financials for this Owner
Home Financials are based on the most recent Mortgage that was taken out on this home.
Original Mortgage
$104,625
Interest Rate
4.4%
Mortgage Type
Purchase Money Mortgage
Purchase Details
Closed on
Jul 24, 2018
Sold by
Sullivan Katie J and Castillo Devyn K
Bought by
Higgins Dwight and Higgins Jo Ann
Purchase Details
Closed on
Aug 31, 2015
Sold by
Higgins Dwight and Higgins Jo Ann
Bought by
Sullivan Katie J and Castillo Devyn K
Purchase Details
Closed on
Aug 3, 2011
Sold by
Jackson Kelly E and Jackson Wilberta P
Bought by
Higgins Dwight and Higgins Jo Ann
Purchase Details
Closed on
Sep 27, 2002
Sold by
Wills Edward L and Wills Marisa R
Bought by
Sullivan Katie J and Castillo Devyn K
Create a Home Valuation Report for This Property
The Home Valuation Report is an in-depth analysis detailing your home's value as well as a comparison with similar homes in the area
Home Values in the Area
Average Home Value in this Area
Purchase History
| Date | Buyer | Sale Price | Title Company |
|---|---|---|---|
| Sharp Macy Lyn | -- | -- | |
| Sharp Cindy Odell | -- | Stewart Title Of Lubbock Inc | |
| Higgins Dwight | -- | Hub City Title | |
| Sullivan Katie J | -- | None Available | |
| Higgins Dwight | -- | Stewart Title Company | |
| Sullivan Katie J | -- | -- |
Source: Public Records
Mortgage History
| Date | Status | Borrower | Loan Amount |
|---|---|---|---|
| Previous Owner | Sharp Cindy Odell | $104,625 |
Source: Public Records
Tax History
| Year | Tax Paid | Tax Assessment Tax Assessment Total Assessment is a certain percentage of the fair market value that is determined by local assessors to be the total taxable value of land and additions on the property. | Land | Improvement |
|---|---|---|---|---|
| 2025 | $3,140 | $201,351 | $18,000 | $183,351 |
| 2024 | $43 | $208,127 | $18,000 | $190,127 |
| 2023 | $4,254 | $203,136 | $18,000 | $185,136 |
| 2022 | $4,102 | $180,161 | $18,000 | $162,161 |
| 2021 | $3,703 | $153,109 | $18,000 | $135,109 |
| 2020 | $3,619 | $148,981 | $18,000 | $130,981 |
| 2019 | $3,542 | $141,678 | $18,000 | $123,678 |
| 2018 | $3,485 | $139,231 | $18,000 | $121,231 |
| 2017 | $3,373 | $134,613 | $18,000 | $116,613 |
| 2016 | $3,252 | $129,799 | $9,600 | $120,199 |
| 2015 | $2,876 | $122,534 | $9,600 | $112,934 |
| 2014 | $2,876 | $114,629 | $9,600 | $105,029 |
Source: Public Records
Map
Nearby Homes
Your Personal Tour Guide
Ask me questions while you tour the home.